


Россия
Россия
BISAC NAT010000 Ecology
BISAC NAT045050 Ecosystems & Habitats / Coastal Regions & Shorelines
BISAC NAT025000 Ecosystems & Habitats / Oceans & Seas
BISAC NAT045030 Ecosystems & Habitats / Polar Regions
BISAC SCI081000 Earth Sciences / Hydrology
BISAC SCI092000 Global Warming & Climate Change
BISAC SCI020000 Life Sciences / Ecology
BISAC SCI039000 Life Sciences / Marine Biology
BISAC SOC053000 Regional Studies
BISAC TEC060000 Marine & Naval
This article presents a new method of laboratory density determination and construction equations of state for marine waters with various ionic compositions and salinities was developed. The validation of the method was performed using the Ocean Standard Seawater and the UNESCO thermodynamic equation of state (EOS-80). Density measurements of water samples from the Aral Sea, the Black Sea and the Issyk-Kul Lake were performed using a high-precision laboratory density meter. The obtained results were compared with the density values calculated for the considered water samples by the EOS-80 equation. It was shown that difference in ionic composition between Standard Seawater and the considered water bodies results in significant inaccuracies in determination of water density using the EOS-80 equation. Basing on the laboratory measurements of density under various salinity and temperature values we constructed a new equation of state for the Aral Sea and the Black Sea water samples and estimated errors for their coefficients.
density of sea water, equation of state, ionic composition, density meter, Standard Seawater, Aral Sea, Black Sea, Issyk-Kul Lake
- INTRODUCTION
The Law of Constant proportions, which states that proportion among quantities of the major ions in the open ocean waters is almost constant and does not significantly depend on their concentration, i.e., salinity, was assumed to be true till the middle of the 20th century. However, research studies in the second part of the 20th century detected significant variability of ionic compositions even in the open ocean waters.
Differences with standard seawater ionic composition (Table 1) are especially large at semi-enclosed seas and water bodies, coastal areas and areas adjacent to continental discharge sources. Moreover, saline lakes, e.g., the Aral Sea and the Caspian Sea, are generally characterized by ionic composition which is totally different from the standard seawater one. As a result application of certain practically important dependences among the main physical parameters (which are true for open ocean water) to many inland seas, coastal areas and saline lakes causes significant errors. In particular, it refers to equations of state, e.g., the dependences of water density on its temperature, salinity and pressure. Usage of seawater equations of state for hyperhaline lakes is limited not only by differences in ionic composition, but also by salinity, because ocean equations of state are applicable only for waters, which salinity and temperature lie within the ranges 0-40‰ and -2-40 °C respectively.
Table 1. Concentrations of the major ions in standard ocean water taken from [1].
|
Ion |
Average concentration |
Range |
Units (per kg) |
|
Lithium |
174 |
average |
ug |
|
Boron |
4,5 |
average |
mg |
|
Carbon |
27,6 |
24 - 30 |
mg |
|
Nitrogen |
420 |
˃1 - 630 |
ug |
|
Fluorine |
1,3 |
average |
mg |
|
Sodium |
10,77 |
average |
g |
|
Magnesium |
1,29 |
average |
g |
|
Aluminium |
540 |
˂10 - 1200 |
ng |
|
Silicon |
2,8 |
˂0,02 - 5 |
mg |
|
Phosphorus |
70 |
˂0,1 - 110 |
ug |
|
Sulphur |
0,904 |
average |
g |
|
Chloride |
19,354 |
average |
g |
|
Potassium |
0,399 |
average |
g |
|
Calcium |
0,412 |
average |
g |
|
Manganese |
14 |
5-200 |
ng |
|
Iron |
55 |
5 - 140 |
ng |
|
Nickel |
0,5 |
0,1 - 0,7 |
ug |
|
Copper |
0,25 |
0,03 - 0,4 |
ug |
|
Zinc |
0,4 |
˂0,01 - 0,6 |
ug |
|
Arsenic |
1,7 |
1,1 - 1,9 |
ug |
|
Bromine |
67 |
average |
mg |
|
Rubidium |
120 |
average |
ug |
|
Strontium |
7,9 |
average |
mg |
|
Cadmium |
80 |
0,1 - 120 |
ng |
|
Iodine |
50 |
25 - 65 |
ug |
|
Caesium |
0,29 |
average |
ug |
|
Barium |
14 |
4 - 20,0 |
ug |
|
Mercury |
1 |
0,4 - 2 |
ng |
|
Lead |
2 |
1 - 35 |
ng |
|
Uranium |
3,3 |
average |
ug |
The most widely used equation of state (EOS-80, [2]) was established in 1980 by the UNESCO Joint Panel on Oceanographic Tables and Standards. Density and several other related seawater properties are calculated using this equation for more than 30 years. A new thermodynamic equation of state of seawater (TEOS-10, [3]) was established by the Scientific Committee on Oceanic Research (SCOR) and the Working Group 127 (WG127) of the International Association for the Physical Sciences of the Oceans (IAPSO) in 2009. The main advantage of TEOS-10 comparing to EOS-80 consists in fact that TEOS-10 does not use practical salinity, which is measured by water conductivity, but operates with absolute salinity, i.e., mass fraction of salt in seawater.
Thus, individual equations of state, which depend on ionic compositions of the considered water bodies, designed for calculation water density basing on its temperature and salinity are required for many sea areas and saline lakes. This article describes a methodology for constructing such equations on the basis of laboratory measurements as well as the first resultsof its application to waters of the modern Aral Sea, north-eastern shelf of the Black Sea adjacent to the Sochi River mouth and the Issyk-Kul Lake.
- METHOD
High accuracy and precision density measurements of sea and lake water samples were performed using laboratory density meter Anton Paar DMA 5000M. This device is applicable to any liquid within a wide range of density and viscosity values; method of measurement does not depend on water ionic composition. The method is based on measurement of vibrations of a U-tube which contains the analyzed water. Resonant frequency of the oscillation tube, measured by optical sensors, depends only on fluid density. Density of a water sample is reconstructed from accurately determined resonant frequency using specific mathematical operations. Errors related to viscosity are automatically corrected for the whole range of viscosities by measuring damping effect of a viscous sample, followed by mathematical correction of density value. Nominal accuracy of density measurements is equal to 10-6 g/cm³. Temperature control of a sample with 0.01 °C accuracy is provided by two embedded platinum thermometers and Peltier elements. The instrument can automatically vary temperature of sample from 0 to 90°C.
The ionic composition of sea and lake water samples were determined by a ion chromatograp Metrohm 930 Compact IC Flex equipped with column thermostat, sequential chemical suppression system, and two built-in degassers: for eluent and for sample. Results obtained by the chromatograph for water samples from the Aral Sea, the Black Sea and the Issyk-Kul Lake showed significant differences with ionic composition of open ocean water (Table 2).
Table 2. Ionic composition of Ocean Standard Seawater taken from [1] and ionic composition
of water samples from the Aral Sea, the Black Sea and the Issyk-Kul Lake
measured by the chromatograph
|
Ion |
Cl¯ |
SO4²¯ |
Br¯ |
HCO3¯ |
NO3¯ |
Na⁺ |
K⁺ |
Ca⁺ |
Mg⁺ |
Cl¯/SO4²¯ |
|
Ocean water |
||||||||||
|
Concentration, g/kg |
19,4 |
2,7 |
0,1 |
0,1 |
⁻ |
10,8 |
0,4 |
0,4 |
1,3 |
0,14 |
|
Concentration, % |
55,1 |
7,7 |
0,2 |
0,4 |
⁻ |
30,6 |
1,1 |
1,2 |
3,7 |
|
|
Black Sea (bottom layer), 12 m, 2014 |
||||||||||
|
Concentration, g/kg |
12,0 |
1,2 |
0,03 |
⁻ |
⁻ |
4,3 |
0,2 |
0,3 |
0,5 |
0,10 |
|
Concentration, % |
64,7 |
6,4 |
0,1 |
⁻ |
⁻ |
23,4 |
0,8 |
1,4 |
2,8 |
|
|
Black Sea (bottom layer), 17 m, 2014 |
||||||||||
|
Concentration, g/kg |
10,9 |
1,1 |
0,02 |
⁻ |
⁻ |
4,2 |
0,2 |
0,2 |
0,6 |
0,10 |
|
Concentration, % |
63,7 |
6,3 |
0,1 |
⁻ |
⁻ |
24,3 |
0,9 |
1,4 |
3,3 |
|
|
Aral Sea (surface layer), 2014 |
||||||||||
|
Concentration, % |
61 |
15,5 |
⁻ |
0,4 |
⁻ |
16,4 |
0,5 |
0,8 |
5,4 |
0,25 |
|
Aral Sea (bottom layer), 34 m, 2014 |
||||||||||
|
Concentration, % |
48 |
19,3 |
⁻ |
0,6 |
⁻ |
23,7 |
0,6 |
0,5 |
0,40 |
|
|
Issik-Kull Lake (surface layer), 2015 |
||||||||||
|
Concentration, g/kg |
2,1 |
3,9 |
⁻ |
⁻ |
0,1 |
1,1 |
0,1 |
0,1 |
0,2 |
1,84 |
|
Concentration, % |
27,5 |
50,7 |
⁻ |
⁻ |
6,5 |
14,9 |
0,7 |
1,7 |
3 |
|
|
Issik-Kull Lake (bottom layer), 640 m, 2015 |
||||||||||
|
Concentration, g/kg |
2,1 |
2,6 |
⁻ |
⁻ |
⁻ |
1,2 |
0,1 |
0,1 |
0,2 |
1,29 |
|
Concentration, % |
32,5 |
41,8 |
⁻ |
⁻ |
⁻ |
19 |
0,9 |
1,9 |
3,7 |
|
Water samples were initially filtered using 0.7 and 0.1 micron membrane filters in order to remove suspended and organic matter. Absolute salinity of samples was determined as concentration of total dissolved solids obtained by gravimetric analysis which included water evaporation and burning of organic matter. The initial samples were diluted with the distilled deionized water in different proportions in order to obtain series of water samples with the same ionic composition and different salinities. Every analyzed water sample was measured three times at the density meter. The obtained results of density measurements were compared with the density values calculated by EOS-80 for the corresponding values of the temperature and salinity. The same procedure was performed for the OSIL Ocean Standard Seawater sample, which is a "standard" of sea water with salinity equal to 35 ‰. As it was expected, the measured and the calculated values for the Ocean Standard Seawater were almost the same (Fig. 1), while for the Aral Sea, the Black Sea and the Issyk-Kul Lake samples they showed significant differences, which is discussed below.
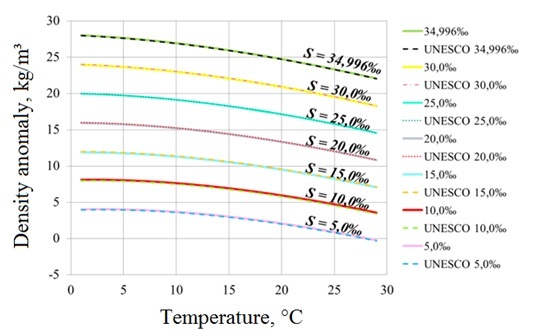
Fig. 1. Dependence of density anomaly on water temperature for Ocean Standard Seawater samples diluted to different salinity concentrations measured experimentally (solid lines) and calculated using EOS-80 (dashed lines).
Then the individual equations of state for the analyzed water bodies were constructed in the following way. We assumed that dependence of density on temperature and salinity is expressed by a bilinear polynomial form:
ρ(T, S) = A0 + A1T + A2T2 + A3S + A4S2 + A5TS, (1)
where ρ is density (in kg/m³), T is temperature (in °C), S is salinity (g/kg), and searched for coefficients A0,...,A5, which provide minimal mean square deviation of (1) from results of direct measurements of (T, S, ρа).
Further analysis requires estimation of measurement errors and determination of confidence intervals for the coefficients of the equations of state. We assume that error of determination of density is equal to standard deviation calculated for three density measurements performed for each water sample. About 68% of values of a random variable with normal distribution lie within one standard deviation of the mean. Therefore we calculate values of coefficients A0,...,A5 for the "upper" (mean value plus standard deviation) and "lower" (mean value minus standard deviation) values of confidence limits of density measurements and assume that the obtained sets of coefficients determine confidence limits for values of A0,...,A5.
- RESULTS
The equation of state for the western basin of the Aral Sea
The Aral Sea is a body of water which exhibited significant degradation caused by human activity [4]. Water samples from the western basin of the Large Aral Sea were collected during the expedition of Shirshov Oceanology Institute in October 2014 (Fig. 2).
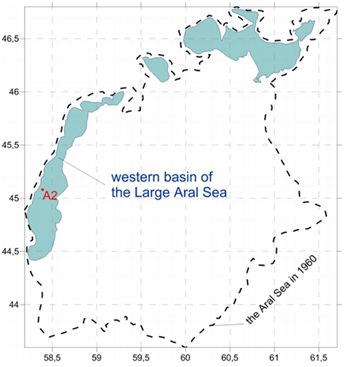
Fig.2. Modern outlines of the Aral Sea, its 1960 border (the dashed line) and the sampling point (station A2)
We analyzed two water samples, he first one was taken from the surface layer and its salinity is equal to 121.6 g/kg, while the second one was taken from the bottom layer (34 m depth) and had salinity of 115.4 g/kg. The first sample was diluted to obtain salinity values equal to 60.8, 30.4 and 15.2 g/kg. Density of each diluted sample was measured three times using a density meter in a temperature range of 1 to 29 °C with a step of 1 °C. The measurement results were compared with density calculated using the formal extrapolation of EOS-80 on hyperhaline salinity ranges (Fig. 3). As it was expected usage of EOS-80 resulted in large errors which exceeded 10 kg/m³.
The coefficients of (1) for surface and bottom layers of the Aral Sea, as well as their standard deviations are presented in Tables 3 and 4. The mean square error for the bottom layer did not exceed 0.21 kg/m3, and for the surface layer did not exceed 0.14 kg/m³.
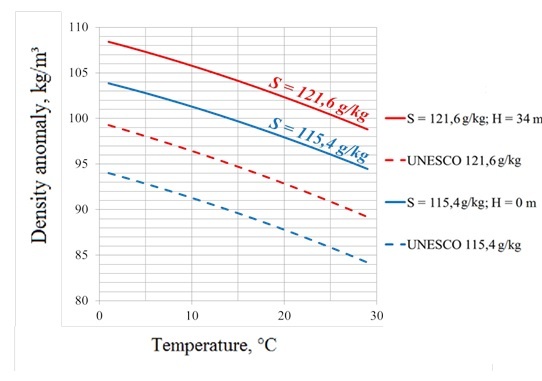
Fig. 3. Dependence of density anomaly on water temperature for the Aral Sea samples taken from the surface (blue) and bottom (red) layers measured experimentally (solid lines) and calculated using EOS-80 (dashed lines).
Table 3. The coefficients of the equation of state for the bottom layer (34 m depth) of the western basin of the Aral Sea.
|
Coefficient |
Value |
Standard deviation |
|
A0 |
0.809 |
0.1306 |
|
A1 |
-0.0354 |
0.0007 |
|
A2 |
-0.0042 |
0.0001 |
|
A3 |
0.8491 |
0.0056 |
|
A4 |
-0.0003 |
0.00005 |
|
A5 |
-0.0014 |
0.0001 |
Table 4. The coefficients of the equation of state for the surface layer of the western basin of the Aral Sea.
|
Coefficient |
Value |
Standard deviation |
|
A0 |
1.052 |
0.0289 |
|
A1 |
-0.0334 |
0.0212 |
|
A2 |
-0.0042 |
0.0006 |
|
A3 |
0.8540 |
0.00165 |
|
A4 |
-0.0003 |
0.00001 |
|
A5 |
-0.0014 |
0.00001 |
The equation of state for the north-eastern coastal zone of the Black Sea
Water samples from the north-eastern coastal zone of the Black Sea were collected during the expedition of Shirshov Oceanology Institute in May 2014 near the mouth of the Sochi River. The Black Sea is characterized by moderate salinity which is equal to 17-18‰ at the surface layer and up to 22.5‰ at the bottom layer. However, salinity of coastal areas of the Black Sea is significantly influenced by continental discharge [5]. In this work we analyzed two samples taken from the Black Sea. The first one was collected near the mouth of the Sochi River and its salinity is equal to 15.5‰, the second one was collected about 1 km far from the shore and had salinity of 16.5‰.
The procedure described above was applied to these water samples and the resulting densities were compared with density values calculated by EOS-80. Fig. 4 illustrates that usage of EOS-80resulted in about 1 kg/m³ underestimation of density for both analyzed samples. The coefficients of (1) for bottom layer of the Black Sea, as well as their standard deviations are presented in Tables 5 and 6.
.jpg)
Fig. 4. Dependence of density anomaly on water temperature for the Black Sea samples taken from the bottom layer from the depth of 7 m (blue) and the depth of 12 m (red) measured experimentally (solid lines) and calculated using EOS-80 (dashed lines).
Table 5. The coefficients of the equation of state for the bottom layer (7 m depth) of the north-eastern coastal zone of the Black Sea.
|
Coefficient |
Value |
Standard deviation |
|
A0 |
-0.2439 |
0.0234 |
|
A1 |
0.0237 |
0.00615 |
|
A2 |
-0.0056 |
0.0002517 |
|
A3 |
0.9947 |
0.0029 |
|
A4 |
-0.009 |
0.0001 |
|
A5 |
-0.0021 |
0.0002 |
Table 6. The coefficients of the equation of state for the bottom layer (12 m depth) of the north-eastern coastal zone of the Black Sea.
|
Coefficient |
Value |
Standard deviation |
|
A0 |
0.2819 |
0.02405 |
|
A1 |
0.0232 |
0.006 |
|
A2 |
-0.0056 |
0.0002517 |
|
A3 |
0.8119 |
0.0025 |
|
A4 |
0.0005 |
0.0001 |
|
A5 |
-0.0021 |
0.00015 |
Density measurements of water samples from the Issyk-Kul Lake
The Issyk-Kul Lake is an endorheic lake in the northern Tian Shan mountains in eastern Kyrgyzstan which receives discharge from about 120 small-size rivers, the largest are the Djyrgalan and Tyup [6]. This low salinity lake is the 6th deepest lake in the world. Water samples from the Issyk-Kul Lake were collected during the expedition of Shirshov Oceanology Institute in June 2015. Water was taken from the surface layer (salinity of 5.9 g/kg) and the bottom layer at the depth of 640 m (salinity of 5.7 g/kg). Unstable vertical distribution of salinity was compensated by a strong thermocline.
The procedure described above was applied to these water samples and the resulting densities were compared with density values calculated by EOS-80. Fig. 6 illustrates that usage of EOS-80 resulted in about 1 g/kg underestimation of density for both analyzed samples.
.jpg)
Fig. 5. Dependence of density anomaly on water temperature for the Issyk-Kul Lake samples taken from the surface layer (yellow) and from the bottom layer from the depth of 640 m (blue) diluted to different salinity concentrations measured experimentally (solid lines) and calculated using EOS-80 (dashed lines).
- ACKNOWLEDGEMENTS
Funding of this research was provided by the Russian Scientific Foundation, research project 14-50-00095. Authors wish to thank P.N. Makkaveev and members of the Laboratory of Hydrochemistry of Shirshov Oceanology Institute; many colleagues who participated in field works at the Aral Sea, the Black Sea and the Issyk-Kul Lake in 2014-2015; "Avrora-lab" Ltd. and personally S.K. Dedushenko and N.P. Kolbyagin.
1. C.P. Summerhayes and S.A. Thorpe, “Oceanography: an illustrated guide, “ Oceanographic Literature Review, vol. 43, pp. 165-181, 1996.
2. N.P. Fofonoff, “Physical properties of seawater: A new salinity scale and equation of state for seawater,” J. Geophys. Res., vol. 90, pp. 3332-3342, 1985.
3. T.J. McDougall, R. Feistel, F.J Millero, D.R. Jackett, D.G. Wright, B.A. King, G.M. Marion, C.T.A. Chen, and P. Spitzer. “Calculation of the Thermophysical Properties of Seawater,” in Global Ship-based Repeat Hydrography Manual, IOCCP Report, vol. 14, 2009.
4. A.S. Izhitskiy, P.O. Zavialov, P.V. Sapozhnikov, G.B. Kirillin, H.P. Grossart, O.Y. Kalinina, A.K. Zalota, I.V. Goncharenko, and A.K. Kurbaniyazov, “Present state of the Aral Sea: diverging physical and biological characteristics of the residual basins,” Scientific Reports, vol. 6, 2016.
5. П.О. Завьялов, П.Н. Маккавеев, Б.В. Коновалов, А.А. Осадчиев, П.В. Хлебопашев, В.В. Пелевин, А.Б. Грабовский, А.C. Ижицкий, И.В. Гончаренко, Д.М. Соловьев, и А.А. Полухин, “Гидрофизические и гидрохимические характеристики морских акваторий у устьев малых рек российского побережья Черного моря,” Океанология, т. 54, с. 293-308, 2014
6. K. Savvaitova and T. Petr, “Lake Issyk-Kul, Kirgizia,” International Journal of Salt Lake Research, vol. 1, pp. 21-46, 1992.