


Россия
BISAC NAT010000 Ecology
BISAC NAT045050 Ecosystems & Habitats / Coastal Regions & Shorelines
BISAC NAT025000 Ecosystems & Habitats / Oceans & Seas
BISAC NAT045030 Ecosystems & Habitats / Polar Regions
BISAC SCI081000 Earth Sciences / Hydrology
BISAC SCI092000 Global Warming & Climate Change
BISAC SCI020000 Life Sciences / Ecology
BISAC SCI039000 Life Sciences / Marine Biology
BISAC SOC053000 Regional Studies
BISAC TEC060000 Marine & Naval
Based on numerical modelling evolution of beach under waves with height 1,0-1,5 m and period 7,5 and 10,6 sec as well as spectral wave parameters varying cross-shore analysed. The beach reformation of coastal zone relief is spatially uneven. It is established that upper part of underwater beach profile become terraced and width of the terrace is in direct pro-portion to wave height and period on the seaward boundary but inversely to angle of wave energy spreading. In addition it was ascertain that the greatest transfiguration of profile was accompanied by existence of bound infragravity waves, smaller part of its energy and shorter mean wave period as well as more significant roller energy.
coastal zone, barred beach, xBeach, sediment transport, wave transformation.
I. Introduction
The dynamic of nearshore beach relief is complicated process and, especially on short timescales, heavily depends on waves and its features of cross-shore propagation. During the evolution in coastal zone waves transform under non-linear dispersive processes, what can lead to variability of individual wave parameters [1]. Also the underwater profile forming can be affected by periodical energy exchange between non-linear harmonics of wave movement appearing during wave propagation shoreward [2, 3].
The main goal of this study was investigation of underwater beach profile evolution forced by waves depending on its spectral parameters.
II. Material and Methods
Study site locates in Skorpilovtsy (Bulgaria, 40 km from Varna), in the middle part of Kamchia-Shkorpilovtsy beach, which is 11.5 km long. Due to processes of sediments’ accumulation from rivers Kamchia and Fyndykliska that are responsible for beach appearance and existence, the dominant sand fraction is originally terrigenous. A schientific-research pier built near the mouth of Fyndykliska river has made regular measurements possible e.g. field experiments Kamchia 1977, 1978, 1986 and Shkorpilovtsy-2007 [4,5].
Underwater slope is covered by anisomerous sands. In the upper part of profile till 2,5 m depth more than 95% bottom sediments contain coarse-grained and medium sands, where quartz components predominate.
Underwater slope smoothed relief and parallel to the shoreline isobaths are typical. One of the features of the beach on the polygon is existence stable underwater bar on the depth 2-3 m, which is oriented under the pier at an angle ≈10°.
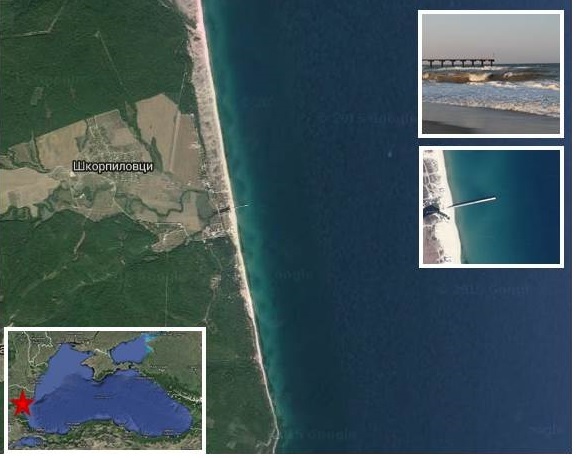
Fig. 1. Study site location
The xBeach with hydrostatic (surfbeat) mode (release 1.22.4867 20.10.2015 “Kingsday”) [6] was used for simulation of morfodynamics, meanwhile MIKE21 with Boussinesq wave module [7] applied for cross-shore wave transformation computing.
Computation grid was build based on 12 profiles of bathymetry survey, conducted on 27th of September 2007 in frame of international experiment “Shkorpilovtsy-2007”. Spatial resolution varies cross-shore between 2-12 m depending on depth, longshore between 20 m in the centre of study area and 50 m on the edges. Fig. 2 shows grid and relief of study site – the central part of grid used in model. In connection with specificity of grid building in xBeach the computational area is mirrored about the meridian.
.jpg)
Numerical experiments were carried out for 12 cases with different wave conditions. Input waves were set on the seaside boundary 1000-1200 m from the shoreline as JONSWAP-spectra with significant wave height 1.0 or 1.5 m, peak period 7.5 or 10.5 sec. and angle of wave energy spreading 5, 15 or 25°, γ=3.3. The main direction of wave approach was set normal to coast. In each case xBeach was run 10 hours. Results of morfodynamics modelling were analysed through mapping spatial distribution of vertical deformations, calculating of shoreline retreat as well as detailed examination of storm deformation of three profiles: one locates under research pier (Pier) and two 60 m south- and northward (fig. 2-3, table 1).
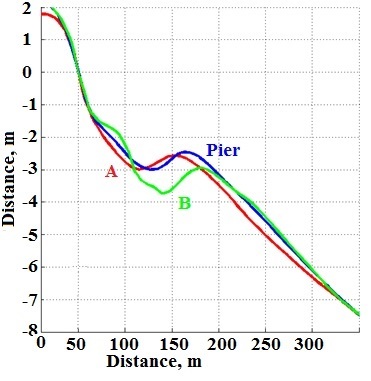
Fig. 3. Initial profiles A, Pier, B
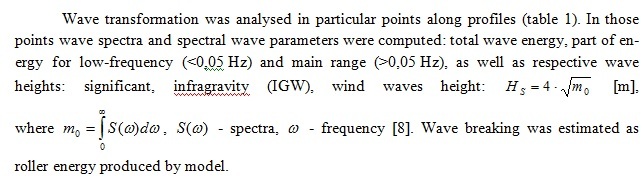
Table 1. Profiles parameters and wave points coordinates
|
Profile |
Distance between bar and coast, m |
True altitude of crest, m |
Relative height of bar, m |
Wave point № |
Distance to coast, m |
|
А |
105 |
-2.6 |
0.4 |
A01 |
35 |
|
A02 |
72 |
||||
|
A03 |
112 |
||||
|
A04 |
142 |
||||
|
Pier |
115 |
-2.5 |
0.5 |
P01 |
20 |
|
P02 |
39 |
||||
|
P03 |
90 |
||||
|
P04 |
130 |
||||
|
P05 |
304 |
||||
|
B |
136 |
-2.9 |
0.6 |
B01 |
16 |
|
B02 |
45 |
||||
|
B03 |
105 |
III. Results and Discussion
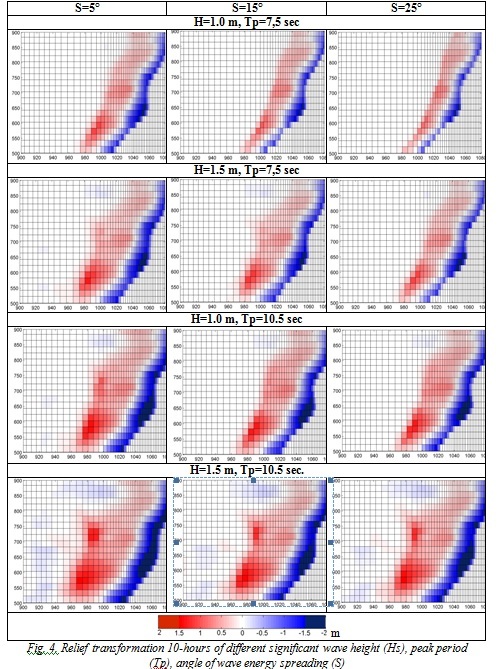
Fig. 4 presents general relief change relative to initial state after 10 hours of wave force for 12 cases with different wave condition.
According to the results of the xBeach computation, regardless of the width of the angular dispersion of wave energy there is erosion along the coastline, and sediment accumulation seaward. The width of wave attackable area increases from south to north 30 to 50 m in case of short (7.5 sec.) and low (1.5 m) waves in comparison to 100-200 m in case of longer (10.5 sec) and higher (1.5 m) waves. Relief transformation is spatially uneven: the greatest accumulation and denudation observed in the central part of study site.
It has to be mentioned that for both wave heights and periods increase of angle of wave energy spreading leads to decent of transformed area. This process is intensively in central part of study site.
Largest vertical deformation of relief (>1.5 m) were observed near the coast. That area broadened with rise of wave height, period and narrowing wave energy spreading.
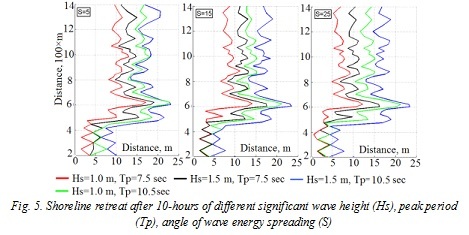
In order to define the most active section of coast, value of shoreline retreat was estimated. It made up 3-10 m in the south part of coast and 10-20 in the central and northern. The maximum erosion (up to 23 m) on the profile for all modes of excitement there was in the area of 603-643 m, which is likely due to the changes the shore bearings.
As a result of wave action upper part of barred profiles A, B and Pier become a terraced, due to process of transport eroded sediment from shore seaward. For all 12 cases terrace formed always and changed slightly only by inclination angle and length. Length of terrace varied from 30-35 m in cases with shorter and lower waves to 80 for longer and higher waves. Fig. 6 shows this process for three chosen profiles for wave conditions with Hs=1.0 m, Tp=10.5 sec., S=5°.
The most active underwater relief deformation observed on profile A: relief levelling, sediment filled hollow before bar, and thus the relative height of bar reduced. In comparison to profiles Pier and B, here length of the formed terrace was shorter, but vertical deformation were more appreciable. The shoreline retreated more also on the profile A. Profile Pier was characterised by the most visible underwater bar levelling.
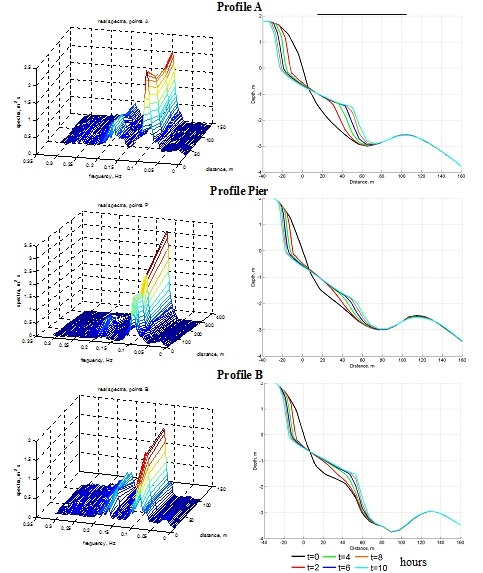
Fig. 6. Characteristical spectra transformation along the pfofiles A, Pier, B (left) and profiles evolution during 10-hours wave forcing with Hs=1,0 m, Tp=10,5 sec and S=5°(right)
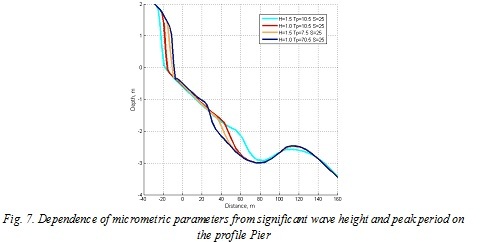
On all three profiles the same dependence shape and position of the terrace on the wave height and period observed. The terrace lies above and is less sloped at the significant wave height 1.0 m than at 1.5 m (Fig. 7). Period spectral peak has a greater influence on the rate of retreat of the coastline and the mowing out of the maritime boundary formed terrace.
Variance of spatial beach change should be caused by different wave transformation scenario. Most importantly all changes of spectral wave parameters occurred similarly for all wave conditions, but different for three chosen profiles. Besides, process of wave transformation becomes more intensive with growth of significant wave height and peak period at the sea boundary. How it is can be seen from spectra on fig. 6, only along profile A there is periodical energy exchange between lowest and highest harmonics.
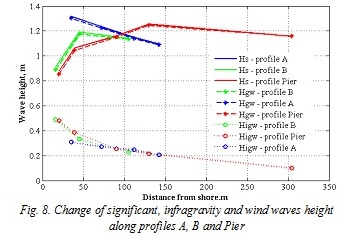
Fig. 8 displays variation of wave height along three profiles calculated for different frequency range: significant (Hs), low-frequency (Higw) and gravity (Hgw). Significant wave height as well as wind waves declined moving shoreward on profiles B and Pier, while on the profile A steady increase was observed. Significant wave height amounted 1,3 m on the profile A exceeds values on 0.2 and 0.4 m for profiles B and Pier at the same distance from shore, respectively. Withal IGW went up approaching coast more gradually on the profile A (from 0.2 m to 0.3 m) in comparison to B and Pier (from 0.2 m to 0.5 m).
Wave breaking (fig. 9-a) is described by roller energy, which varies for profiles considerably. On the profile A breaking was most active. I could be assumed that breaking slightly eliminated advance of IGW due to energy exchange between low- and high-frequency harmonics, as well as IGW dissipation.
.jpg)
Mean period of waves (fig. 9-b) could play important role in coastal reshaping, e.g. some previous research showed that reduction of mean period may lead to wave load. Mean wave period near the coast on profile A is less than on profiles B and Pier, that could be explained by growth of highest harmonics after bar and producing it as secondary waves along hollow.
IV. Conclusion
It is revealed that changes of parameters of waves influence on deformations of a profile of a bottom: at increasing of significant height of a wave, the period and reduction of angle of wave energy spreading there is an increase in deformation of a bottom profile. The form and location of underwater structure, which is formed under the influence of waves, depend on significant height and the period of waves. The period of spectral peak more influences on the speed of degradation of the coastline than significant wave height.
Active impact of waves on deeper parts of an underwater profile begins at preservation of the same wave conditions more than 3 hours.
There is heterogeneity of change of a bottom profile in the northern and southern directions which is caused by the features of transformation of irregular waves over this bottom profile leading to non-uniform variability of a field of infragravity waves.
V. Acknowledgment
The research is supported by Russian Foundation for Basic Reseatch: grants No. 15-35-51195, 15-05-08239 and 16-35-00542.
1. Saprykina Ya.V., S.Yu. Kuznetsov, Zh. Cherneva, N. Andreeva, 2009. Spatio-temporal variability of the amplitude-phase structure of storm waves in the coastal zone of the sea. Oceanology, Volume 49, Issue 2, pp. 182-192.
2. Boczar-Karakiewicz B., Davidson-Arnott R. Nearshore bar formation by non-linear process - a comparison of model results and field data // Marine Geol. 1987. v. 77, pp. 287-304.
3. Ya. V. Saprykina, S. Yu. Kuznetsov, N. K. Andreeva, M. N. Shtremel, 2013. Scenar-ios of nonlinear wave transformation in the coastal zone. Oceanology, Volume 53, Issue 4, pp 422-431
4. The interaction between atmosphere, hydrosphere and lithosphere in the coastal zone ("Kamchia-78"). Sofia: Bulgarian Academy of Sciences, 1982. С.158-162. (in Bulgarian)
5. Kuznetsova O., Saprykina Ya., Trifonova E. Wave impact on changes of underwater profile of barred beach. Proceedings of the Twelfth International Conference on the Mediterra-nean Coastal Environment MEDCOAST 2015, 06-10 October 2015, Varna, Bulgaria, E. Ozhan (Editor). P.891-899.
6. Roelvink D. (P.I.), Reniers A., van Dongeren A., van Thiel de Vries J., Lescinski J., McCall R. XBeach Model Description and Manual. Unesco-IHE Institute for Water Education, Deltares and Delft University of Technology. URL: http://oss.deltares.nl/web/xbeach/
7. Warren I.R., H.K. Bach., 1992. MIKE 21: a modelling system for estuaries, coastal waters and seas. Environmental Software, Volume 7, Issue 4, Pages 229-240.
8. Coastal engineering manual. Department of the Army U.S. Army Corps of Engineers. Washington, DC 20314-1000, 2008