


BISAC NAT010000 Ecology
BISAC NAT045050 Ecosystems & Habitats / Coastal Regions & Shorelines
BISAC NAT025000 Ecosystems & Habitats / Oceans & Seas
BISAC NAT045030 Ecosystems & Habitats / Polar Regions
BISAC SCI081000 Earth Sciences / Hydrology
BISAC SCI092000 Global Warming & Climate Change
BISAC SCI020000 Life Sciences / Ecology
BISAC SCI039000 Life Sciences / Marine Biology
BISAC SOC053000 Regional Studies
BISAC TEC060000 Marine & Naval
A simple ecosystem model of the upper layer of the north-western shelf of the Black Sea (NWS of BS) was considered. Estimates of phytoplankton, zooplankton, bioresources and oxygen concentrations were used as the basic biochemical characteristics of the ecosystem. The ecosystem was affected by external conditions: the seasonal temperature and chlorophyll-a concentrations. The adaptive balance of causes method was used to construct ecosystem model equations. The equations had the property of dynamic adaptation to variable external influences. Аpplying this model we illustrated the two-step method of modeling marine ecosystems processes, using adaptive models. On the first step, dynamics of water masses movement was calculated by a numerical model. On the second step, the ecosystem model made the local adjustment of ecosystem variables to each other, taking into account the available estimates of advection and diffusion of substances. In this simulation advection and diffusion calculated by the hydrodynamic model presented external forces relative to the ecosystem substances in the local volume. Maps of annual spatial and temporal variability of fields of phytoplankton, zooplankton, oxygen and biological resources concentrations in the upper layer NWS of BS were made. It was shown, that using data about the dynamics of marine environment in the adaptive models of ecosystems enable to detail the maps of biochemical fields.
adaptive balance of causes method, marine ecosystem
I. Introduction
Applied problems of monitoring the state of the marine environment for the use of its resources require the construction of diagnostic and prognostic maps of biochemical components of marine ecosystems, according to observations. The main source of these data, satellite observations are a component of the ecosystem, obtained by remote sensing of the sea surface. Therefore adaptation of model estimates of biochemical components of marine ecosystems, calculated on a relatively simple integral model, to satellite observations is one of the most of perspective directions using satellite information.
For mapping the fields of biochemical components of marine ecosystems are usually applied numerical models of high resolution in which the concentration of biological objects and chemical substances are calculated by the equations describing the transport and diffusion of substances in the sea [1]. In this paper, the possibilities of a two-step mapping biochemical fields by the method of adaptive balance of causes (ABC-method) that has the property of local adaptation of the model variables of the ecosystem are shown [2, 3]. In the first step are carried out calculations of currents by hydrodynamic models to construct estimates of advection and diffusion in grid nodes covering the study area. On the second step these estimates and satellite observations are used as external sources of influence in special models of the marine ecosystem. Since the task of a detailed description of biochemical processes in this paper is not intended as a conceptual model of the upper layer of the marine ecosystem have chosen the simplest scheme of causality, including the concentration of phytoplankton, zooplankton, bioresourses and dissolved oxygen.
II. Adaptive Balance of Causes Method
Adaptive Balance of Causes method (ABC-method) was developed in the Marine hydrophysical institute and successfully used by the authors in the modeling of ecological-economic systems [3 - 5]. System principle of the adaptive balance causes [3] postulates the desire of all natural systems to a state of dynamic equilibrium with each other and attached to them external influences. The existence of equilibrium is due to the balance of positive and negative feedbacks, which are formed inside the system by causal relationships between processes. On the basis of this principle, in [3] proposed an adaptive balance the effects of the method for modeling of complex systems, which is constructed on two system concepts:
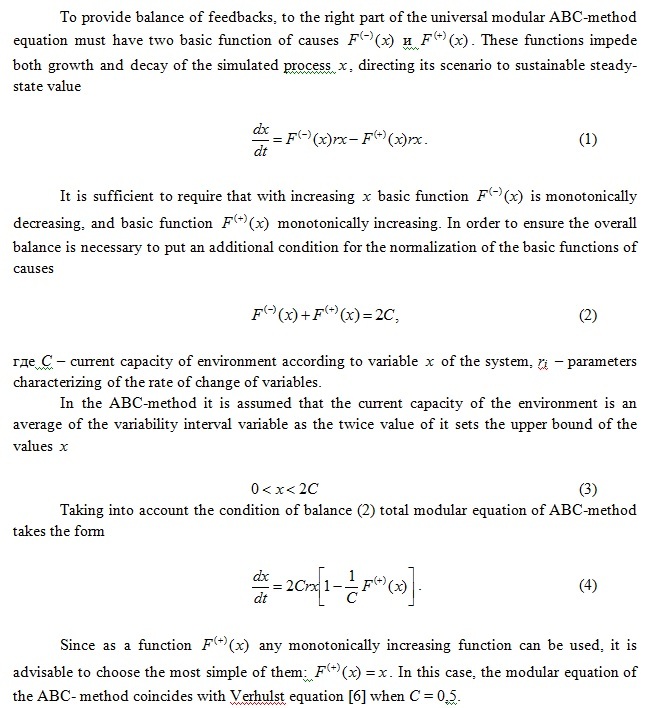
1. There is a universal modular equation expressing the rate of change of any of the processes modeled in the form of managed balance sheet growth trends and the decreasing of the process, which provides the internal balance of positive and negative feedback in each of the equations.
2. Combining modular equations to the system of dynamic equations of model should ensure the simultaneous pursuit of solutions of these equations to the stationary state of the system in which the intra-relationship between the development processes are adapted to each other and to external influences, exerted on the system.
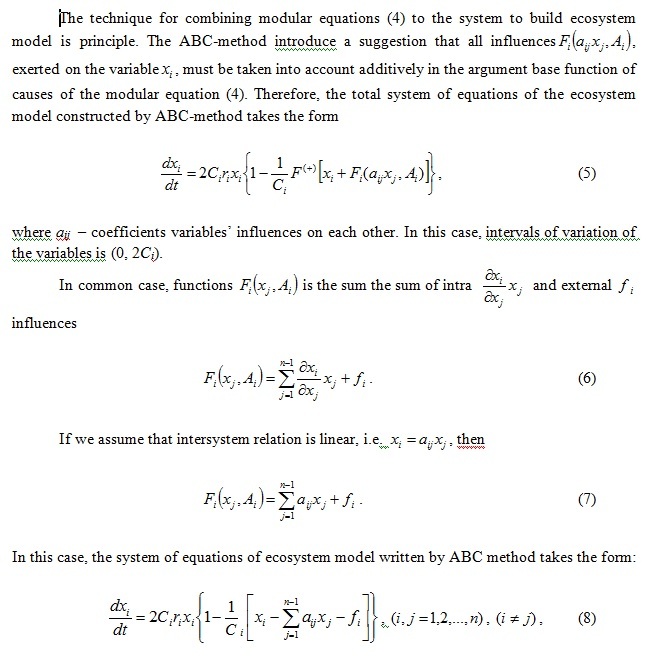
The restriction of the limits to growth of variables depends not only on the current capacities of the natural environment in relation to the variables, but also on the intra-factors action. For example, the zooplankton concentration increase depends on the availability of all necessary resources: phytoplankton, oxygen, chemicals and other growth factors. At each time moment one of these factors is limited, because this type resources growth of concentration is a minimal amount comparing to the other resources. Therefore management agents should present in marine ecosystem models The management agents monitor and control the dynamics of resource provision of living organisms and the conditions of chemical reactions [3].
As a rule, the management agents are logical operators that switch functions of causes by the prescribed rules. One of the convenient expressions for a management agent can serve as a formula
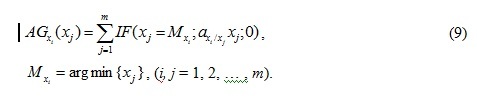
Such switching functions of sources and sinks in the process of solving the equations of the ecosystem model increase the demands on the stability of the solution algorithms. Therefore, the stability of adaptive models of the second order, which is provided by negative feedback , is very useful when using the management agents growth of concentrations of ecosystem living objects.
III. Аdaptive model of the Black Sea upper layer ecosystem
We call the ecosystem models adaptive if at the presence of external influences a model tends to the state of dynamical equilibrium with them. A mutual adaptation of the model values to each other and to the external influences occurs in the adaptive models, and a set of equations of the model “monitors” varying external influences keeping a state of dynamic balance with them.
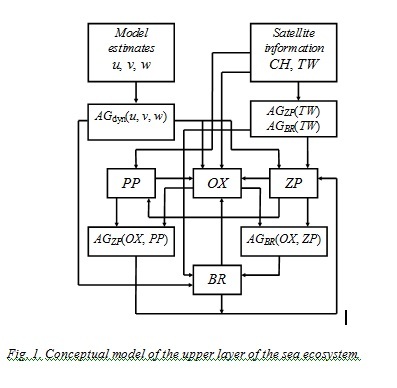
As a conceptual model of the upper layer of the marine ecosystem have chosen the simplest scheme (Fig.1) of cause-effect relationships of processes taking place in the North-Western shelf of the Black Sea (NWS BS).
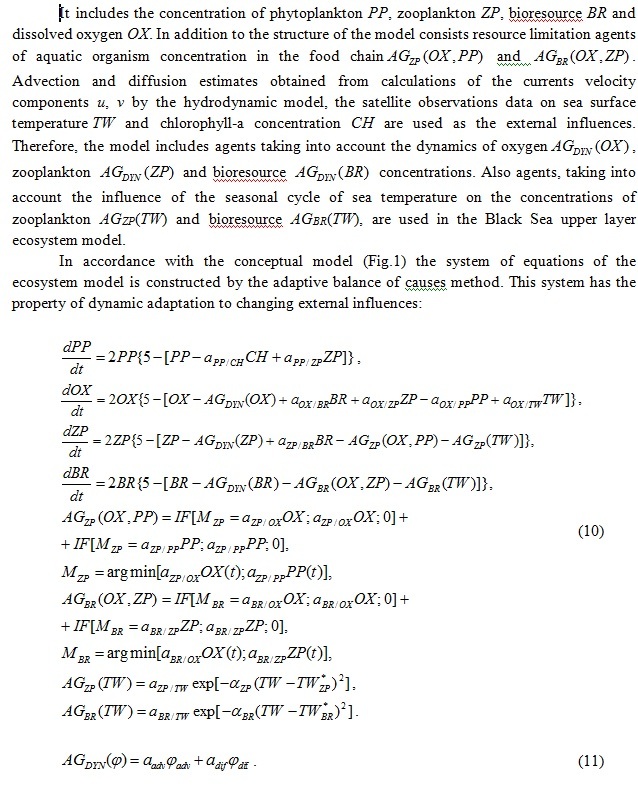
For the comparison of scenarios to be easier, model variables were represented in dimensionless form and were reduced to the common interval of variability (0,10). It should be noted that phytoplankton advection and diffusion are indi-rectly taken into consideration in the equation (10) because the satellite measurement data on СН chlorophyll-a concentration, formed under effect of advection and diffusion, had been used as an external influence source in this equation. Through system of equations of the model this influence is also extended to other model variables. However, it is insignificant due to the fact that the influence of previous resource factors decreases with each transition to the new reaction. This is the cause of diffusion and advection inclusion in all other model equations. Current velocities and turbulent exchange coefficients, taken from the calculations by the hydrodynamic model, introduce an additional data on environment dynamics, therefore the management agentsin the system (10) are the additional sources of influences on the substance concentration changes.
IV. Mapping biochemical fields in the upper layer of the Black Sea
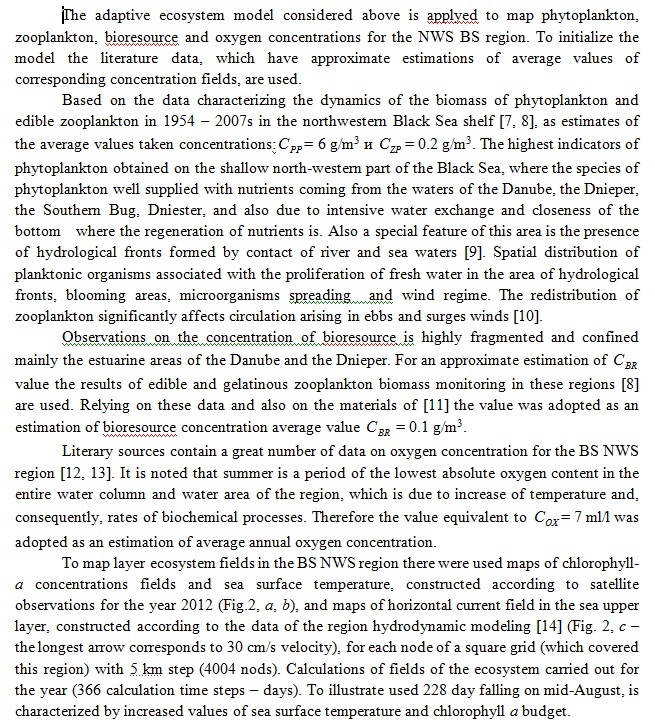
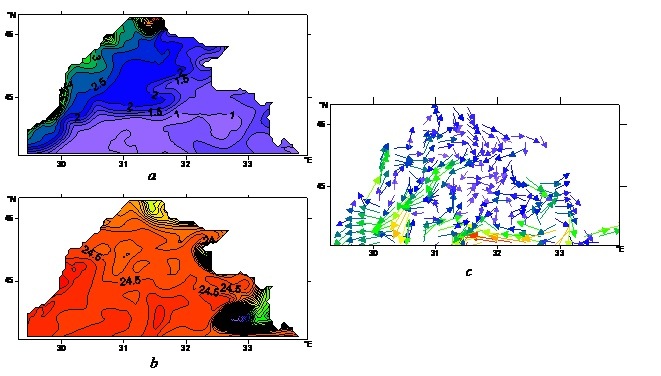
Fig. 2. NWS BS maps, obtained on 228 days of the year (mid-August)
according satellite observations:
a – chlorophyll-а (mg/m3), b – sea surface temperature (°С);
according numerical simulation data: c – currents.
Calculations of ecosystem variables were carried out in two stages. Initially, the model equations (10) were solved in each nod of the grid domain with no regard for advection and diffusion. As a result, the scenarios of within-year variation of all ecosystem parameters, by which the charts of substance concentration spatial distributions for each day were constructed subsequently, had been calculated. These data, alongside with the calculations of horizontal currents, were used to obtain the advection and diffusion assessments in each node of grid domain for each day of experiment. Advection and diffusion were calculated by standard finite-difference formulas.
At the second stage the local adaptation of model variables to the obtained advection and diffusion assessments was performed by means of model (10). These assessments were included into the management agents (11had the meaning of time intervals during which the advective and diffusive supplements to the concentrations of substances. Thus, the assessments of advection and diffusion have served as additional sources of external influences in the ecosystem model equations.
In Fig. 3, а map of phytoplankton concentration, constructed without taking into account the marine environment dynamicsпо by the temporal scenarios calculated in the nods of grid domain, is given. The structure of isolines on this map basically follows the one from Fig. 2, а (the map of chlorophyll-a concentration constructed according to the satellite data).
The map of oxygen concentration represented in Fig. 3, б demonstrates that it was sufficiently affected by satellite data on sea surface temperature and phytoplankton concentration. The map of sea surface temperature (Fig. 2, б), constructed by satellite data, contains a notable anomaly in the area of south-western coast of the Crimea, and this anomaly is due to anticyclonic gyres. This anomaly clearly manifested itself in the oxygen concentration field (Fig. 3, б).
A dominant role in the formation scenarios of zooplankton and bioresource concentrations play the minimum oxygen concentrations. Therefore it should be expected that the oxygen field anomaly will manifest itself in the maps of zooplankton and bioresource concentrations. The maps of these fields, represented in Fig. 3, c, d confirm this statement. The greatest zooplankton and bioresource concentrations are observed in the Danube estuary coastal regions and the lowest concentrations – in the area of oxygen field anomaly near the south-western coast of the Crimea.
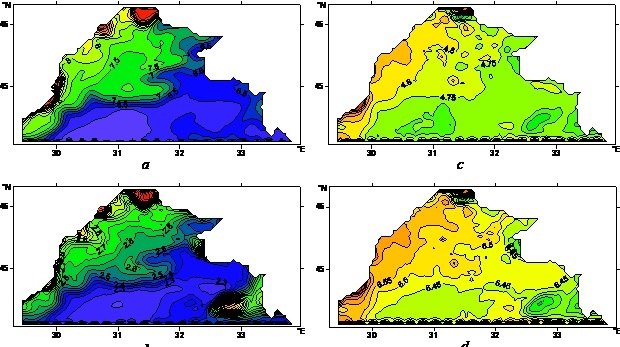
Fig. 3. Maps of ecosystem fields, calculated without taking into account the dynamics of the marine environment
228 computing days (mid-August):
a – phytoplankton (dimensionless units), b – oxygen (dimensionless units),
c – zooplankton (dimensionless units), d – bioresource (dimensionless units).
The map of phytoplankton concentration, which was calculated taking into account the marine environment dynamics on the mid-August (the 228th day of computations is represented in Fig. 4, а. This field appeared to be more changeable in comparison with the one given in Fig.3, а, which was obtained at the first stage. Local inhomogeneities of chlorophyll-a field, which had been observed on the chart of its concentrations in Fig. 2, а near the north-western coast of the BS NWS water area, , were not visible in the chart of phytoplankton concentration (Fig. 3, а), constructed excluding the water dynamics. Taking into account the dynamics, they explicitly manifested themselves in Fig. 4, а.
This conclusion also extends to other ecosystem fields constructed with regard to advection and diffusion. This is evidenced by the results of the comparison of appropriate oxygen (Fig. 3, b and 4, b), zooplankton (Fig. 3, c and 4, c) and bioresource (Fig. 3, d and 4, d) concentrations. Thus, marine environment dynamics sufficiently affects the results of ecosystem field modeling using the Adaptive Balance of Causes method.
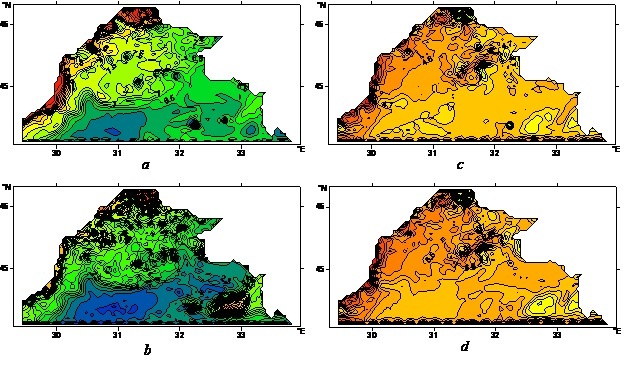
Fig. 4. Maps of ecosystem fields calculated with advection and diffusion
228 computing days (mid-August):
a – phytoplankton (dimensionless units), b – oxygen (dimensionless units),
c – zooplankton (dimensionless units), d – bioresource (dimensionless units).
V. Conclusions
Adaptive NWS BS marine ecosystem model was used to illustrate the suggested two-step method of mapping fields of the upper layer of the sea ecosystem, which allows to assimilate transport processes and the diffusion of substances calculated by hydrodynamic models. The equations of the ABC-method provided the construction of maps of phytoplankton, zooplankton, bioresourse and oxygen concentrations by the use of satellite data and results of the advection and diffusion numerical modeling for investigated region of marine environment. ABC-model of the marine ecosystem has been used for mapping interannual spatial and temporal variability of phytoplankton, zooplankton, oxygen and biological resources concentrations fields for the upper layer NWS BS adapted to satellite observations of chlorophyll concentration and sea surface temperature. Thus, according to satellite data spatio-temporal dynamics of the ecosystem for this year's conditions were restored. It is shown that taking into account the dynamics of the marine environment and the agents of the resource limitation in adaptive ecosystem models allow to assess the detailed maps of biochemical fields.
1. G. K. Korotaev, T. Oguz, V. L. Dorofeyev, S. G. Demyshev, A. I. Kubryakov, et al, “Development of Black Sea nowcasting and forecasting system”, Ocean Sci., no. 7, pp. 629-649, 2011.
2. I.Е. Timchenko, Е.М. Igumnova, I.I. Timchenko, System Management and ABC-technologies of sustainable development, Sevastopol, ECOSI-Gidrofizika, 2000, 225 p. (in Russian).
3. V.A. Ivanov, E.M. Igumnova, I.E. Timchenko, Coastal Zone Resources Management, Kyiv, Akademperiodika, 2012, 304 p.
4. I.E. Timchenko, V.A. Zhorov, E.M. Igumnova, I.P. Lazarchuk, “Dynamic model of integrated processes in the ecosystem of the northwest shelf of the Black Sea”, Physical Oceanography, vol. 17, issue 4, pp. 223-241, 2007 (Translated from Morskoi Gidrofizicheskii Zhurnal, No. 4, pp. 48-69, 2007).
5. I.E. Timchenko, I.K.Ivashchenko, E.M. Igumnova, I.P. Lazarchuk, “Estimation of the space distributions of the parameters of marine ecosystems by the method of adaptive balance of causes Sea”, Physical Oceanography, vol. 21, issue 5, pp.338-352, 2012. (Translated from Morskoi Gidrofizicheskii Zhurnal, No. 5, pp. 50-65, 2011)
6. J.D Murray. Mathematical biology II: Spatial models and biomedical applications, 3rd edition. Springer, 2008, 736 p.
7. D. Nesterova, S. Moncheva, A. Mikaelyan, A. Vershinin, V. Akatov et al. “The state of phytoplankton”, State of the Environment of the Black Sea (2001- 2006/7),Istanbul, Turkey, 2008, pp.173-200.
8. T. Shiganova., E. Musaeva, E. Arashkevich, L. Kamburska, K. Stephanova et al. “The State of Zooplankton”, State of the Environment of the Black Sea (2001- 2006/7),Istanbul, Turkey, 2008, pp. 201- 246.
9. L. V. Grigorieva, L.G. Senichkina. “Phytoplankton of the Black sea: the current state and prospects of research ”, Ecology of the sea, vol.45, pp.6-13, 1996. (in Russian).
10. V. I. Belyaev, N.V. Konduforova “ Mathematical modeling of ecological systems of shelf ”,Kyiv.: Naukova dumka, 1990, 240 p. (in Russian).
11. V.S. Latun,.“The impact of fisheries on the sustainability of the Black Sea ecosystem”, Stability and evolution of oceanographic characteristics of the Black Sea ecosystem, Sevastopol, ECOSI-Gidrofizika, 2012, pp. 331-353 (in Russian).
12. V.А. Emelyanov, А.Yu. Mitropolskiy, Е.I. Nasedkin A. A. Pasynkov, Yu. D. Stepanyak, et al, Geoecology Ukrainian Black Sea shelf, Kyiv, Akademperiodika, 2004, 296 p. (in Russian).
13. I.G. Orlova, M.Yu. Pavlenko, V.V. Ukrainskiy, Yu.I. Popov, Hydrological and hydro-chemical indicators of the northwest shelf of the Black Sea, Chief Ed. I.D. Loeva, Kyiv, KNT, 2008,616 p. (in Ukrainian)
14. 7. http://www.myocean.eu/ (date: 03 of June 2013).