


BISAC NAT010000 Ecology
BISAC NAT045050 Ecosystems & Habitats / Coastal Regions & Shorelines
BISAC NAT025000 Ecosystems & Habitats / Oceans & Seas
BISAC NAT045030 Ecosystems & Habitats / Polar Regions
BISAC SCI081000 Earth Sciences / Hydrology
BISAC SCI092000 Global Warming & Climate Change
BISAC SCI020000 Life Sciences / Ecology
BISAC SCI039000 Life Sciences / Marine Biology
BISAC SOC053000 Regional Studies
BISAC TEC060000 Marine & Naval
Coastal zone of the Eastern Gulf of Finland is subjected to essential natural and anthropogenic impact. The processes of abrasion and accumulation are predominant. While some coastal protection structures are old and ruined the problem of monitoring and coastal management is actual. Remotely sensed data is important component of geospatial information for coastal environment research. Rapid development of modern satellite remote sensing techniques and data processing algorithms made this data essential for monitoring and management. Multispectral imagers of modern high resolution satellites make it possible to produce advanced image processing, such as relative water depths estimation, sea-bottom classification and detection of changes in shallow water environment. In the framework of the project of development of new coast protection plan for the Kurortny District of St.-Petersburg a series of archival and modern satellite images were collected and analyzed. As a result several schemes of underwater parts of coastal zone and schemes of relative bathymetry for the key areas were produced. The comparative analysis of multi-temporal images allow us to reveal trends of environmental changes in the study areas. This information, compared with field observations, shows that remotely sensed data is useful and efficient for geospatial planning and development of new coast protection scheme.
coastal zones, monitoring, remote sensing, multispectral image processing, coastal landscapes
I. Introduction
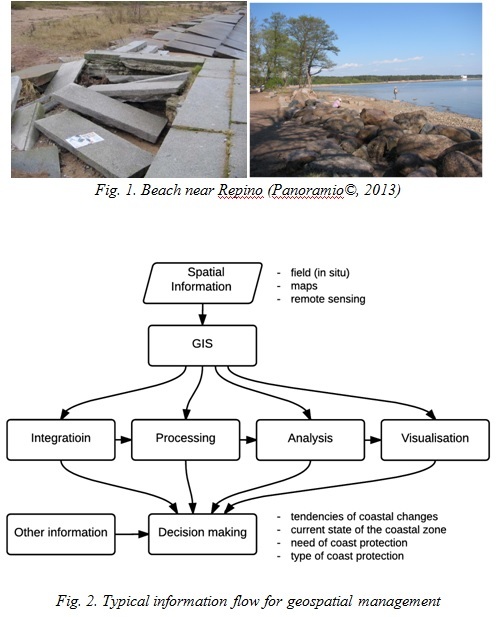
Eastern part of the Gulf of Finland is the eastern extremity of the Baltic Sea basin. The coastal zone in this region is affected by both natural and anthropogenic impact. Lithodynamic processes, such as abrasion and accumulation are predominant here. The amount of coast-protecting structures are situated here. Some of them are old and ruined (see Fig. 1). The problem of monitoring and management this constructions is actual. The new plan of coast protection is currently under development by several organizations of St.-Petersburg, including government agencies and research institutions.
Some changes in coastal zone, such as accretion of beaches, degrading of the shoreline or destruction of coastal buildings occurs by extremely high speeds. For understanding and forecasting of currently undergoing processes there is need in different monitoring techniques. The information flow for data from different sources for integration and decision making is presented on Fig. 2.
II. Materials and methods
Satellite imagery is significant component of spatial data for coastal zones study and management. Over past twenty years there was seen substantial development of satellite passive remote sensing systems in visible and near-infrared range and high spatial resolution, such as QuickBird, GeoEye, Pleiades, WorldView 2,3 with resolution higher than 2 m, which approximate it to aerial survey.
Image processing techniques for multiband satellite images allow to obtain georeferenced information concerning both sub-aeral and subaquatic coastal landscapes, sea bottom features, changes of shoreline and other coastal properties.
In current research the 8-channel images from satellite sensors WorldView-2 and WorldView-3 was used. The main characteristics of data are shown in table 1. The images cover eastern part of the Kurortny District (see Fig. 3.). The images was acquired at June 8, 2013 and October 18, 2014.
Table 1. WorldView-2 and WorldView-3 sensors characteristics
|
|
channel |
WorldView-2 |
WorldView-3 |
|
Spatial resolution |
panchromatic |
0,46 |
0,31 |
|
multispectral |
1,84 |
1,24 |
|
|
Wavelengths (mm) |
panchromatic |
0,50–0,90 |
|
|
coastal |
0,40–0,45 |
||
|
blue |
0,45–0,51 |
||
|
green |
0,51–0,58 |
||
|
yellow |
0,585–0,625 |
||
|
red |
0,63–0,69 |
||
|
red edge |
0,705–0,745 |
||
|
NIR-1 |
0,77–0,895 |
||
|
NIR-2 |
0,86–1,04 |
||
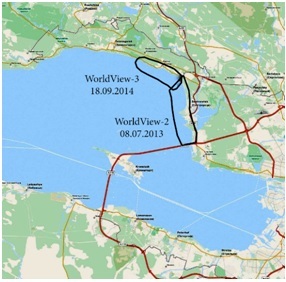
Fig. 3. Coverage of multispectral images
Image pre-processing
For further processing we use radiometrcally corrected and georeferenced images (level 1C or 1D in CEOS classification). Ortho-transformation is not essentially required for current region because relative flat relief.
The graph of processing of images for coastal research purposes is shown at Fig. 4.
For converting of non-dimensional digital number (DN) values of each pixel (radiometric calibration) to the physical values of radiance the re-calculation formula was used:

where LlPixel,Band is top-of-atmosphere band-integrated spectral radiance, Kband is the absolute radiometric calibration factor, qPixel,Band — digital number pixel values, Dlband — the effective bandwidth for a given band. This data are stored in the image metadata file provided with the image [1], [2]. The procedure might be done using simple raster algebra, but in such image processing software as ENVI the module of TOA calibration is integrated.
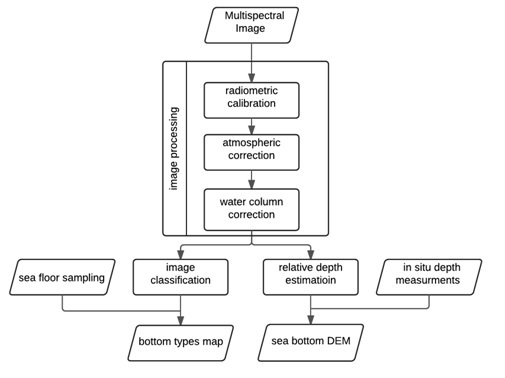
Fig. 4. Flowchart of multispectral image processing for sea bottom investigation
Radiometric correction
The correction for the purpose for sea bottom investigations consist of two parts: atmospheric correction and water column correction.
Atmospheric correction is used to reduce the effect of atmosphere absorption and scattering to the spectrum. Atmospheric correction is carried using algorithms based on different atmospheric models, such as FLAASH and 6S [3]–[5]. Sometimes, depending from atmospheric characteristics, such effect is significant (see Fig. 5). The complex methods of water column correction are proposed in several publications [6]–[8].
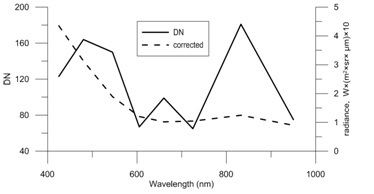
Fig. 5. Stacked spectra of corrected reflectance vs DN-values for subaquatic sample point
Sea bottom classification
Unsupervised classification is fast method to highlight structure of sub-aeral and sub-aquatic surface without ground truth. Algorithms are based on clustering of pixels in feature space based on values of reflectance. Supervised classification is more developed method, which allows us to use spectral signatures of known ground areas to extract features from image. The methods are well described in [9]–[11].
Relative depth estimation.
If the optical properties and reflectance at deep water is known, the increase in reflectance due to the presence of a finite bottom might be interpreted in terms of depth [6]. While bathymetric survey at shallow water is expensive and difficult and LiDAR survey is limited due to high price, the passive mulitispectral data is good source of bathymetric data.
Obtaining bathymetry using passive multispectral and hyperspectral remote sensing was coined by R. D. Lyzenga [12], and developed by remote sensing community [7], [13]–[15].
The Lyzenga method is based on assumption that amount of scattered and reflected radiance depends on water composition, type of sea bottom (albedo) and depth. The method is good for case I and type II water, but some researchers apply modified method for water type II to III [8]. For satisfactory results the image should be acquired at appropriate weather conditions (low wind and choppiness, low water turbidity). Suitability to these conditions is the main challenge for the Eastern part of Gulf of Finland.
III. Results
On the study area generation of underwater bars is widely developed. For highlighting of spatial structure of bars we use K-Means algorithm of image classification. After classification several classes were merged to produce comparable images. The results of sea bottom classification are shown on Fig 6a and 7a. Using described method the subaquatic relief was separated into classes, associated with different types of underwater relief. The structure of bars on the schemes is highlighted.
For water depth estimation the module of ENVI package was used. The result is displayed at Fig. 6b and 7b.
Using obtained data the coastal zone may be separated into sectors in which different structure of underwater relief is observed. This information make a contribution for understanding of lithodynamic processes in different areas of coastal zone.
The multispectral high resolution satellite images is useful geospatial information for coastal zone monitoring. The information about underwater relief and bottom reflectance may be obtained using advanced image processing techniques. The state of atmosphere and water conditions, such as turbidity, swells, phytoplankton may contaminate signal from sea bottom. These conditions should be considered during image acquisition and processing.
.jpg)
.jpg)
IV. Acknowledgment
Author acknowledge collective of Research Institute of Remote Sensing Methods for Geology (NIIKAM), especially Dr. Leontina Suchacheva for providing data and ideas for this work. Special thanks to collective of department of marine geology and geoecology of A.P. Karpinsky Russian Geological Research Institute (VSEGEI): Dr. Michail Spiridonov, Dr. Daria Ryabchuk, Dr. Alexander Sergeev for collaboration in research work.
1. “Radiometric Use of WorldView-2 Imagery. Technical Note. WorldView-2 Instrument Description.,” 2010. [Online]. Available: http://global.digitalglobe.com/sites/default/files/Radiometric_Use_of_WorldView-2_Imagery (1).pdf. [Accessed: 10-May-2016].
2. K. Krause, “Radiometric Use of QuickBird Imagery,” World, pp. 1-18, 2005.
3. A. Berk, S. M. Adler-Golden, A. J. Ratkowski, G. W. Felde, G. P. Anderson, M. L. Hoke, T. Cooley, J. H. Chetwynd, J. A. Gardner, M. W. Matthew, L. S. Bernstein, P. K. Acharya, D. Miller, and P. Lewis, “Exploiting MODTRAN radiation transport for atmospheric correction: The FLAASH algorithm,” in Proceedings of the 5th International Conference on Information Fusion, FUSION 2002, 2002, vol. 2, pp. 798-803.
4. T. Cooley and G. Anderson, “FLAASH, a MODTRAN4-based atmospheric correction algorithm, its application and validation,” Geosci. Remote Sens. Symp., vol. 3, no. C, pp. 1414-1418, 2002.
5. ENVI Atmospheric Correction Module: QUAC and FLAASH user’s guide. 2009.
6. C. Yang, D. Yang, W. Cao, J. Zhao, G. Wang, Z. Sun, Z. Xu, and M. S. Ravi Kumar, “Analysis of seagrass reflectivity by using a water column correction algorithm,” Int. J. Remote Sens., vol. 31, no. 17-18, pp. 4595-4608, 2010.
7. A. Kanno and Y. Tanaka, “Modified Lyzenga’s method for estimating generalized coefficients of satellite-based predictor of shallow water depth,” IEEE Geosci. Remote Sens. Lett., vol. 9, no. 4, pp. 715-719, 2012.
8. T. Sagawa, E. Boisnier, T. Komatsu, K. Ben Mustapha, A. Hattour, N. Kosaka, and S. Miyazaki, “Using bottom surface reflectance to map coastal marine areas: a new application method for Lyzenga’s model,” Int. J. Remote Sens., vol. 31, no. 12, pp. 3051-3064, 2010.
9. M. Deidda, “Pre-processing of high resolution satellite images for sea bottom classification,” Italian Journal of Remote Sensing. pp. 83-95, 2012.
10. H. M. Tulldahl, P. Philipson, H. Kautsky, and S. A. Wikström, “Sea floor classification with satellite data and airborne lidar bathymetry,” in SPIE Defense, Security, and Sensing, 2013.
11. S. Ohlendorf, A. Müller, T. Heege, S. Cerdeira-Estrada, and H. T. Kobryn, “Bathymetry mapping and sea floor classification using multispectral satellite data and standardized physics-based data processing,” Remote Sens. Ocean. Sea Ice, Coast. Waters, Large Water Reg., pp. 1-10, 2011.
12. D. R. Lyzenga, “Passive remote sensing techniques for mapping water depth and bottom features.,” Appl. Opt., vol. 17, no. 3, pp. 379-383, 1978.
13. D. R. Lyzenga, “Shallow-water bathymetry using combined lidar and passive multispectral scanner data,” Int. J. Remote Sens., vol. 6, no. 1, pp. 115-125, 1985.
14. A. Kanno, Y. Koibuchi, and M. Isobe, “Shallow Water Bathymetry From Multispectral Satellite Images: Extensions of Lyzenga’s Method for Improving Accuracy,” Coast. Eng. J., vol. 53, no. 04, pp. 431-450, 2011.
15. D. R. Lyzenga, “Remote sensing of bottom reflectance and water attenuation parameters in shallow water using aircraft and Landsat data,” Int. J. Remote Sens., vol. 2, no. 1, pp. 71-82, 1981.