


BISAC NAT010000 Ecology
BISAC NAT045050 Ecosystems & Habitats / Coastal Regions & Shorelines
BISAC NAT025000 Ecosystems & Habitats / Oceans & Seas
BISAC NAT045030 Ecosystems & Habitats / Polar Regions
BISAC SCI081000 Earth Sciences / Hydrology
BISAC SCI092000 Global Warming & Climate Change
BISAC SCI020000 Life Sciences / Ecology
BISAC SCI039000 Life Sciences / Marine Biology
BISAC SOC053000 Regional Studies
BISAC TEC060000 Marine & Naval
In enclosed water areas, organic matters are actively produced by phytoplankton due to abundant nutrient supply from the rivers. In our study area of the semi-enclosed Hiroshima Bay, oyster farming consuming high primary production has been developed since the 1950s, and the oyster production of Hiroshima prefecture have had the largest market share (ca. 60%) in Japan. In this study, species composition of phytoplankton, primary production, and secondary production of net zooplanktons and oysters were determined seasonally at seven stations in the bay between November 2014 and August 2015. In the bay, diatoms including Skeletonema costatum dominated during the period of the study. The primary productions markedly increased during summer (August), and its mean values in the northern part of the bay (NB) and the southern part (SB) were 530 and 313 mgC/m2/d, respectively. The productions of net zooplankton and oyster increased during the warm season, and its mean values in the NB were 14 and 1.2 mgC/m2/d, and in SB were 28 and 0.9 mgC/m2/d, respectively. The energy transfer efficiencies from the primary producers to the secondary producers in the NB and SB were 2.8% and 9.1%, respectively. However, the transfer efficiency to the oysters was approximately 0.3% in the bay. This study clearly showed the spatial difference of the productions and transfer efficiencies, and the low contribution of the production of oysters in secondary productions in Hiroshima Bay.
Contribution, Diatom, Primary production, Secondary production, Seto Inland Sea
I. INTRODUCTION
Biological productivity of lower trophic levels is important to support the production of higher trophic levels of food webs. Riverine supply of inorganic nutrients to estuaries makes these areas of high primary production potential [1], and blooms of microalgae (Harmful Algal Blooms, HABs) exert major impact on organisms in the marine food web [2]. In enclosed water areas such as lakes, estuaries, and bays, farming of bivalves has been conducted in order to utilize the high primary productivity of the area. Bivalve farming is increasing rapidly in concentrated areas around the world [3]. In 2010, farming production of molluscs including bivalves is responsible for 24% of all farming production in the world [4]. The broader ecological issues associated with the elevated bivalve farming include the effects of pests (fouling pests, toxic/noxious microalgae, disease), creation of novel habitat (by fouling of farm structures and accumulation of shell), alteration of nutrient cycling, depletion of suspended particulate matter by their feeding, and related effects on higher trophic level animals including fish, seabirds, and marine mammals [5]. On the other hand, bivalve farming has the advantage of utilizing its natural environment such that feeding is unnecessary, inhibits occurrence of HABs due to their feeding activities in the eutrophic water, and has high market value as a fishery resource.
Our study area, Seto Inland Sea is located in the western part of Japan. The water area is 23,203 km2, and the eleventh largest semi-enclosed sea in the world. In the 1950s-70s, eutrophication occurred in this area during high economic growth period of industrialization and urbanization due to human activities. Thus, organic matter and nutrient (nitrogen and phosphorus) loadings have been reduced according to the Water Pollution Control Law (1970) and the Law Concerning Special Measures for Conservation of the Environment of the Seto Inland Sea (1973). However, recently, problems such as discoloration of seaweed (red algae, Nori) and decline of fish catches have occurred, and they might be causally related to oligotrophication [6].
As a model case for understanding of the effect of the bivalve farming to the productivity of lower trophic levels, we evaluated Hiroshima Bay in the Seto Inland Sea. In the bay, oyster farming has been developed since 1950s, and the annual production in recent years was approximately 20 thousand tons, which constitutes 50-60 % of the total Japanese production. In contrast, production of fishes in the bay started to decreased in 1990, and in recent years, the amount of the fish production decreased less than half relative to the production in 1988, which was the peak year [7]. Therefore, there is a possibility that the energy flow from the primary producers to the oysters is larger than that of the zooplanktons due to the intensive oyster farming in the bay.
Recently, carrying capacity studies in relation to appropriate bivalve farming have been conducted. These studies have clarified social and ecological carrying capacities by mass-balance modeling using Ecopath [8, 9] and by water renewal estimate using local conservative tracer methods [10]. Reference [11] reported the economic impacts of sustainable farming development in Rhode Island, US. Thus, the ecosystem services and economic values of bivalve farming in the coastal marine ecosystem have been re-evaluated.
In this study, we conducted seasonal investigations in Hiroshima Bay which had the largest scale of oyster farming in Japan, and determined the species composition of phytoplanktons, primary production, and secondary production of the net zooplanktons and oysters, and their estimated energy transfer efficiency. From the results, we clarified the impact of the oyster farming on the biological productivity of lower trophic levels and temporal and spatial variations of the productive structure, and discussed the spatial difference of the transfer efficiencies and the carrying capacity of oyster farming in the bay.
II. MATERIALS AND METHOD
Study area
We established seven sampling stations (Stns H1-7) in Hiroshima Bay, Seto Inland Sea, Japan (Stn H5: 34°15’59” N, 132°20’59” E) (Fig. 1). We conducted seasonal investigations (four times per year) of biological productivity of lower trophic levels at these stations between September 2014 and August 2015. In the bay, Ohta River empties into the innermost part of the bay, and mean river water discharge is approximately 7 × 10⁶ m3/d [12]. There are many rafts for farming of oysters throughout the whole bay, and they were densely arranged in the northern part of the bay.
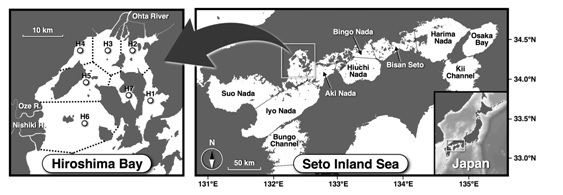
Fig. 1. Sampling sites in Hiroshima Bay, Seto Inland Sea, Japan (Stns H1-7). Dashed lines in the bay indicate the border lines of the sea sections defined by Voronoi tesselation.
Sampling procedures
At the seven stations (Stns H1-7), hydrological measurements and sampling of the water and zooplanktons were carried out from a ship. Water quality measurements (temperature, salinity, fluorescence, photon flux density, etc.) were conducted using a probe (AAQ176, JFE Advantec, Kobe, Japan), and 4 L of water samples in plastic bottles were collected with a Van Dorn water sampler at depths of 100, 50, and 10% surface irradiance. The net-zooplanktons samples were collected vertically by Kitahara plankton net (100 µm mesh opening) from 1 m above the sea floor to the surface, and were fixed immediately with formaldehyde on the ship.
Sample treatment and analysis
In the laboratory, surface water samples fixed with 1% glutaraldehyde were observed with a microscope, and cell density of phytoplanktons were determined. For the determination of chlorophyll a (Chl.a) concentration, 300 ml of water samples were filtered through glass-fiber filters (GF/F, Whatman, Maidstone, UK), and the residues on the filters were extracted with 10 ml of 90% acetone in dark conditions at -20°C for 16-24 hours. The extracts were sonicated for 20 min, and their Chl.a concentrations were determined fluorophotometrically (10-AU-5, Turner Designs, Sunnyvale, CA, USA), according to Welschmeyer method [13]. For the estimation of the primary production, the water samples were filtered through a 220 µm mesh screen to remove large zooplankton and were transferred into 500 mL polycarbonate bottles, wherein light intensity (50 and 10%) was regulated by density filters. After the addition of NaH13CO3, the bottles were incubated immediately in a culture tank at situ temperature with ca. 200 µmol-photons/m2/sec of light intensity for four hours. After incubation, the samples were filtered through precombusted GF/F filters (450°C for 4 h), treated with 1N HCl for removal of inorganic carbon, and stored at -20°C until isotope analysis. Particulate organic carbon (POC) and atom% of 13C of the residuals on the dried filters (60°C for 48 h) were analyzed by elemental analyzer-isotope ratio mass spectrometer (FlashA EA1112-DELTA V ADVANTAGE, Thermo Fisher Scientific, MA, USA). The photosynthetic rate was calculated according to Reference [14].
PB=PP/CHL (1)
where PB indicates the Chl.a specific productivity (mgC/mgChl.a/h). PP is the photosynthetic rate (mgC/m3/h). CHL is the Chl.a concentration (mgChl.a/m3). Primary productions in the euphotic zone (surface to depth of 1% surface irradiance) of the bay were obtained using the following equations:
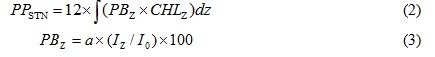
PPSTN is primary production in the euphotic zone at a station (mgC/m2/d). PBZ is Chl.a specific productivity at a depth of z in m (mgC/mgChl.a/h). a is a regression coefficient between relative irradiance (%) and Chl.a specific productivity in the bay at each seasonal investigation. Iz and I0 indicate photon flux density (µmol-photons/m2/sec) at a depth z, and at the surface, respectively.
For estimation of the secondary productions, the net zooplanktons were identified, counted, and their body length measured under a microscope. Biomass of the net zooplanktons in the water was estimated using length-weight relationships of each species [15]. Their secondary productions were calculated by regression equation between specific growth rate (g/d) and temperature [16].
The secondary productions of the oyster were calculated from an ecosystem model incorporating population growth model of the oyster reported by Reference [17] in the bay [18]. Seasonal mean values of the secondary productions between 2009 and 2013 were obtained as representative value for recent years.
The Hiroshima Bay was horizontally divided into two areas, namely the north part (NB) and south part of the bay (SB) [2, 19]. Therefore, the area was divided into seven sections based on sampling stations (Stns H1-7) by Voronoi tesselation, and the productions of NB (Stns H1-4) and SB (Stns H5, 6) in the bay were evaluated as follows:
Data analysis
Chl.a specific productivity was estimated as

PPSEA indicates the productions of the NB or SB (mgC/m2/d). ASEC is the area of the each section corresponding to the stations defined by Voronoi tessellation (m2). ASEA is the area of the NB or SB.
III. RESULTS
Species composition of phytoplanktons
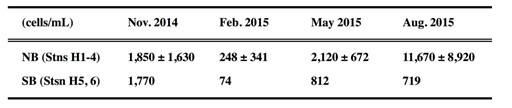
Diatoms dominated at all stations during the period of this study (Fig. 2). The dominant species changed seasonally, Skeletonema costatum dominated in November 2014 (mean of seven stations: 77%) and in August 2015 (41%). In February and May 2015, Chaetoceros spp. (47%) and Leptocylindrus spp. (52%) dominated, respectively. Although, there is no difference in the dominant species between the NB and the SB, the cell densities of the phytoplanktons in the NB were higher than that of the SB throughout the period of this study (Table 1). The cell density markedly increased in warm seasons, and reached a peak in NB in August (11,670 ± 8,920 cells/mL, mean ± SD).
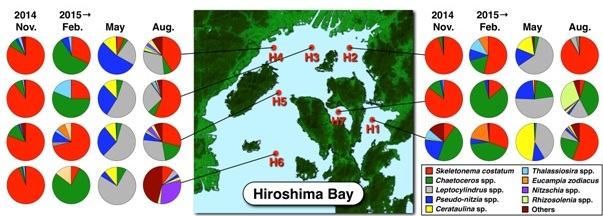
Fig. 2. Seasonal variations of the species compositions (%) of phytoplanktons in the bay between November 2014 and August 2015.
Primary production
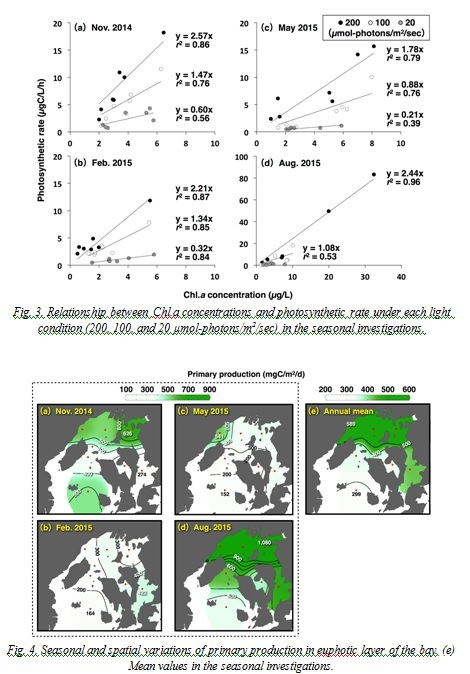
There were significant positive correlations between Chl.a concentrations and photosynthetic rate under each light condition (200, 100, and 20 µmol-photons/m2/sec) during the seasonal investigations (Fig. 3). The maximum values of the Chl.a concentrations (32 µg/L) and the photosynthetic rate (83 µgC/L/h) were observed in the surface water of Stn H2 in August (Fig. 3(d)). Maximum value of the Chl.a specific productivity (µgC/µgChl.a/h) defined as regression coefficient between them was observed in the surface water (200 µmol-photons/m2/sec) in November (2.57 µgC/µgChl.a/h), and tended to increase in the surface during warm seasons.
Seasonal and spatial variations of primary production in the euphotic layer in the bay are indicated in Fig. 4. During the study period, the primary production varied between 152 and 1,080 mgC/m2/d at all stations, and tended to increase in the NB (Fig. 4(e)) during warm seasons (Fig. 4(a,d)).
Secondary production
Population density of the net zooplankton varied 145-1,010×103 ind./m2, and copepods of genus Oithona and Paracalanus dominated (mean 45.7%) during the study period. Biomass and secondary productions fluctuated 43-311 mgC/m2 and 6-66 mgC/m2/d, respectively (Fig. 5), and the secondary productions tended to increase in the SB (Fig. 5(j)). Depth standardized secondary productions (the secondary productions per square meter divided by the depth) in the NB (mean of four stations) in November, February, May, and August were 0.77, 0.50, 0.62, and 1.81 mgC/m3/d, respectively. In the SB (mean of two stations), values were 1.52, 0.54, 0.43, and 0.62 mgC/m3/d, showing lower or similar levels compared to the NB except in November
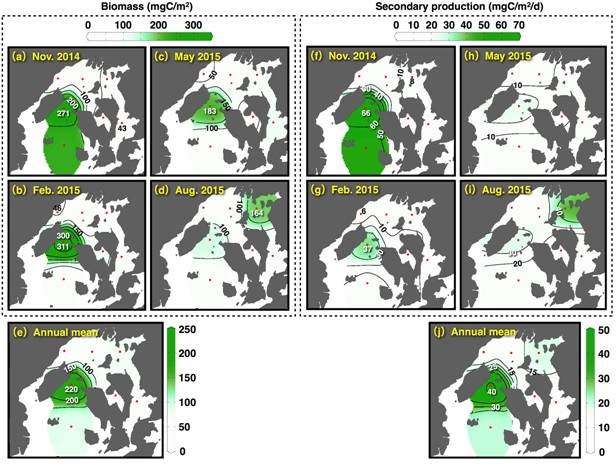
Fig. 5. Seasonal and spatial variations of (a-d) biomass and (f-i) secondary production of net zooplanktons in the bay. (e) and (j) shows the mean values of the biomass and the secondary production in the seasonal investigations
Primary and secondary productions in NB and SB
Seasonal variations of the primary production in the euphotic layer, the secondary production of the net zooplanktons, and the secondary production of the oysters in the NB and SB are shown in Fig. 6. The primary productions in the NB and SB varied between 319-919 and 183-443 mgC/m2/d, respectively, and increased in the NB during warm seasons (Fig. 6(a)). The annual mean value in the NB (530 mgC/m2/d) was 1.7 times higher than that of the SB (313 mgC/m2/d). The secondary productions of the net zooplanktons in the NB and the SB fluctuated 8-27 and 15-56 mgC/m2/d, respectively, and tended to increase during warm seasons (Fig. 6(b)). The annual mean value in the SB (28 mgC/m2/d) was twice as high as that of the NB (14 mgC/m2/d), and indicated different spatial pattern compared to the primary production. The secondary productions of the oysters also increased during warm seasons (Fig. 6(c)), and tended to be high in the NB where there are many rafts used for oyster farming. However, the secondary productions of the oyster were approximately twenty times as low as the net zooplanktons.
.jpg)
Fig. 6. Seasonal variations of (a) the primary production in euphotic layer, (b) the secondary production of net zooplanktons, and (c) secondary production of oysters in the NB (Stns H1-4) and the SB (Stns H5, 6). The production of the each section was spatially weighted by the section area defined by Voronoi tesselation.
Energy transfer efficiency
The transfer efficiencies of the carbon from the primary producers to the oysters were extremely low (approximately 0.3%) in both the NB and the SB (Fig. 7). In all seasons, the transfer efficiencies to the secondary producers were relatively low (annual mean: 2.8%) in the NB compared to the SB (9.1%). The reason for this is that in the NB, the primary production was high while secondary production was low. The transfer efficiencies to the secondary producers fluctuated in a large range in the SB (5.2-13.2%), and reached a peak in Autumn.
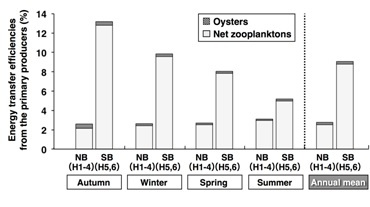
Fig. 7. Seasonal variations of the energy transfer efficiencies from the primary producers to the secondary producers (oysters and net zooplanktons) in the bay.
IV. DISCUSSION
Spatial difference of the transfer efficiencies
The species compositions of the phytoplanktons varied seasonally rather than spatially between the NB and the SB. On the other hand, the cell density of the surface water and the primary production in the euphotic layer dramatically increased in the NB throughout the year due to abundant nutrients supply from the Ohta River. In the NB, the transfer efficiencies of the carbon from the primary producers to the secondary producers were significantly low compared to the SB due to the high primary productions and low secondary productions. While in the SB, which represents the offshore area, the secondary productions and transfer efficiencies were high. Therefore, it is likely that the offshore area plays an important role in the energy flow to the higher trophic levels in the food webs in the coastal sea. Reference [20] defined the sea province as oceanic, coastal, and upwelling area, and estimated each transfer efficiencies (10, 15, and 20%, respectively). In this study, we divided the Hiroshima Bay into an estuary (NB) and offshore area (SB), and clarified the spatial difference of the biological productivity of the lower trophic levels in the coastal area. Due to the differences in ecosystem, when the location changes, transfer efficiency changes [21]. In this study, differences were also found in a localized area of the bay.
In the NB, the constant high primary productions and low secondary production (mostly due to the net zooplanktons) were observed throughout the year. The water depth of the NB (12-22 m) was relatively shallow compared to the SB (36-45 m). The depth standardized secondary productions in the NB and the SB were on the same levels during the study periods. Therefore, the water depth was an important factor in controlling the secondary productivity in the coastal area. These results showed that the large amount of organic matters produced by the primary producers in the estuary (NB) were deposited onto the sediment without being consumed by pelagic animals. The high organic loading to the benthic environment in the NB was responsible for the high Ignition loss (IL) and Acid-volatile sulfide (AVS) content of the sediment in this area [22]. Therefore, it is believed that the spatial difference of the transfer efficiencies contributed to the degree of the organic loading to the sea floor, to the subsequent changes of the species compositions and the biomass of the macrobenthic fauna, and to the biological productivity of the higher trophic levels in the coastal area.
Carrying capacity of oyster farming
Oyster farming utilizing the high primary productivity has been shown in enclosed water areas around the world. In Hiroshima Bay, competition for food between the net zooplanktons and the oysters had not been observed due to the extremely low contributions of transfer efficiencies of the oysters. The oyster consumes suspended matters as food source, which are not only phytoplanktons but also heterotrophic protists through the microbial loop [23]. There are abundant heterotrophic protists in the coastal areas in Hiroshima Bay and heterotrophic protists, ciliates, have often dominated in micro-zooplanktons [24]. This study was conducted without considering the secondary productions coming from the microbial loop. Therefore, it was highly likely that the transfer efficiencies from the primary producers and the heterotrophic protists to the oysters could be lower than the percentages found in this study. From the above results, we concluded that the scale of oyster farming in Hiroshima Bay was not a restricting factor in the classical grazing food chain.
The mass-balance modeling using Ecopath have been introduced in last two decades for the estimation of the production potential of oysters on a farm. In the modeling, the ecological carrying capacity was used to evaluate the level of farm development beyond which ecological impacts of farming become unacceptable [25]. Reference [8] estimated the ecological carrying capacity in barrier-beach lagoons (area: 1.5-7.8 km2) of the southern shore of Rhode Island. They showed that farmed oyster biomass was currently at 0.233 gDW/m2 and could increase 62 times this value without exceeding the ecological carrying capacity to 14.5 gDW/m2. In the larger Narragansett Bay (355 km2) of Rhode Island, the farmed oyster biomass was currently at 0.0095 gDW/m2 and could be increased 625 times to 5.93 gDW/m2 without exceeding its capacity [9]. In the case of the Hiroshima Bay (ca. 0.023 gDW/m2, 410 km2), although the approach of evaluation for the production potential of the oyster on the farm was different for Ecopath, Hiroshima Bay could potentially increase the carrying capacity several times larger than the current biomass. It was assumed that the abundant rafts for farming of oysters in the inner part of the bay (NB) created an organically-polluted benthic environment with low transfer efficiency and that significant oyster feeding lead to the reduction of phytoplankton deposition on the sea floor. Furthermore, increasing the rafts for oyster farming will give an economic boost in the bay area in terms of fishery resources.
V. CONCLUSION
As a model case for understanding the effect of bivalve farming to the productivity of lower trophic levels in coastal areas, Hiroshima Bay in the Seto Inland Sea was evaluated. In this study, Hiroshima Bay was divided into an estuary (NB) and an offshore area (SB), and the spatial difference of the primary productions, the secondary productions, and those of transfer efficiencies in the bay were clarified. The results showed the possibility that the production of oyster in the bay could increase potentially several times as large as the current biomass, without exceeding its carrying capacity.
VI. ACKNOWLEDGEMENT
The authors show appreciation to Mr. Kouji Takeuchi, Mr. Youhei Shigeoka, Mr. Katsuya Ohura, Mr. Yoshiyuki Takahashi, for piloting the survey ship (HIKARI). We express our gratitude to Hiroshi Shibata, M.Sc., and students of Hiroshima University, Kobe University, and National Institute of Technology, Hiroshima College for their support during the surveys, and Dr. Cervinia V. Manalo (Hiroshima University) for her English check. This research was financially supported by the Environment Research and Technology Development Fund (S-13) granted by the Ministry of the Environment, Japan
1. I.R. Joint and A.J. Pomroy, “Primary production in a turbid estuary,” Estuar. Coast Shelf Sci., vol. 13, pp. 303-316, September 1981.
2. D.M. Anderson, “Turning back the harmful red tide,” Nature, vol. 388, pp. 513-514, August 1997.
3. FAO, “State of the World's Fisheries and Aquaculture 2008,” Fisheries Department, Food and Agriculture Organization of the United Nations, Rome, Italy, 2009, 196 pp.
4. A.M. Mathiesen, “The State of the World Fisheries and Aquaculture 2012,” Food and Agriculture Organization, Rome, Italy, 2012, 290 pp.
5. B.M. Forrest, N.B. Keeley, G.A. Hopkins, S.C. Webb, and D.M. Clement, “Bivalve aquaculture in estuaries: Review and synthesis of oyster cultivation effects,” Aquaculture, Vol. 298, pp.1-15, December 2009.
6. T. Yamamoto, “The Seto Inland Sea - Eutrophic or Oligotrophic?,” Mar. Pollut. Bull., vol. 47, pp. 37-42, January-June 2003.
7. Ministry of Agriculture, Forestry and Fisheries, “Statistics on Fishery and Aquaculture Production,” http://www.maff.go.jp/j/tokei/kouhyou/kaimen_gyosei/, Accessed 15 May 2016. (in Japanese)
8. C. Byron, J. Link, B. Costa-Pierce, and D. Bengtson, “Modeling ecological carrying capacity of shellfish aquaculture in highly flushed temperate lagoons,” Aquaculture, vol. 314, pp. 87-99, April 2011.
9. C. Byron, J. Link, B. Costa-Pierce, and D. Bengtson, “Calculating ecological carrying capacity of shellfish aquaculture using mass-balance modeling: Narragansett Bay, Rhode Island,” Ecol. Model., vol. 222, pp. 1743-1755, May 2011.
10. T. Guyondet, V.G. Koutitonsky, and S. Roy, “Effects of water renewal estimates on the oyster aquaculture potential of an inshore area,” J. Mar. Sys., vol. 58, pp. 35-51, October 2005.
11. C.J. Byron, D. Jin, and T.M. Dalton, “An Integrated Ecological-Economic Modeling Framework for the Sustainable Management of Oyster Farming,” Aquaculture, vol. 447, pp. 15-22, October 2015.
12. T. Yamamoto, M. Ishida, and T. Seiki, “Long-term variation in phosphorus and nitrogen concentrations in the Ohta River water, Hiroshima, Japan as a major factor causing the change in phytoplankton species composition,” Bull. Jpn. Soc. Fish. Oceanogr., vol. 66, pp. 102-109, February 2002.
13. N.A. Welschmeyer, “Fluorometric analysis of chlorophyll a in the presence of chlorophyll b and pheopigments,” Limnol. Oceanogr., vol. 39, pp. 1985-1992, June 1994.
14. T. Hama, T. Miyazaki, Y. Ogawa, T. Iwakuma, M. Takahashi, A. Otsuki, and S. Ichimura, “Measurement of Photosynthetic Production of a Marine Phytoplankton Population Using a Stable 13C Isotope,” Mar. Biol., vol. 73, pp. 31-36, March 1983.
15. S. Uye, N. Nagao, and H. Tamaki, “Geographical and seasonal variations in abundance, biomass and estimated production rates of microzooplankton in the Inland Sea of Japan,” J. Oceanogr., vol. 52, pp. 689-703, November 1996.
16. S. Uye and T. Shimazu, “Geographical and seasonal variations in abundance, biomass and estimated production rates of meso- and macrozooplankton in the Inland Sea of Japan,” J. Oceanogr., vol. 53, pp. 529-538, May 1997.
17. O. Kawaguchi, Y. Hirata, M. Wakano, T. Yamamoto, and H. Mutsuda, “Evaluation of organic matter load in different methods of oyster culture,” Nippon Suisan Gakkaishi, vol. 77, pp. 1043-1050, August 2011. (in Japanese)
18. H. Yamamoto, T. Yamamoto, T. Takada, Y. Mito, and T. Takahashi, “Analysis of Oxygen-Deficient Water Mass Formed in the Northern Part of Hiroshima Bay Using a Pelagic-Benthic Coupled Ecosystem Model,” J. Jpn. Soc. Water Environ., vol. 34, pp. 19-28, 2011. (in Japanese)
19. J. Kittiwanich, T. Yamamoto, O. Kawaguchi, and I. Madinabeitia, “Assessing responses of the Hiroshima Bay ecosystem to increasing or decreasing phosphoru and nitrogen inputs,” Mar. Pollut. Bull., vol. 102, pp. 256-264, January 2016.
20. J.H. Ryther, “Photosynthesis and fish production in the sea,” Science, vol. 166, pp. 72-76, October 1969.
21. R. Danovaro, C. Gambi, and S. Mirto, “Meiofaunal production and energy transfer efficiency in a seagrass Posidonia oceanica bed in the western Mediterranean,” Mar. Ecol. Prog. Ser., vol. 234, pp. 95-104, June 2002.
22. T. Yamamoto, O. Matsuda, T. Hashimoto, and H. Imose, “Relationship Observed among Loss of lgnition,Oxidation-Reduction Potential and Acid-Volatile Sulfide Content of Surface Sediment from the Seto Inland Sea,Japan,” Bull. Coast. Oceanogr., vol. 36, pp. 171-176, February 1999. (in Japanese)
23. C. Dupuy, A. Pastoureaud, M. Ryckaert, P.G. Sauriau, and H. Montanié, “Impact of the oyster Crassostrea gigas on microbial community in Atlantic coastal ponds near La Rochelle,” Aquat. Microb. Ecol., vol. 22, pp. 227-242, October 2000.
24. T. Kamiyama, “The impact of grazing by microzooplankton in northern Hiroshima Bay, the Seto Inland Sea, Japan,” Mar. Biol., vol. 119, pp. 77-88, April 1994.
25. G.J. Inglis, B.J. Hayden, and A.H. Ross, “An overview of factors affecting the carrying capacity of coastal embayments for mussel culture,” Client Report CHC00/69, NIWA, Christchurch, New Zealand, 2000, 31 pp.