BISAC NAT010000 Ecology
BISAC NAT045050 Ecosystems & Habitats / Coastal Regions & Shorelines
BISAC NAT025000 Ecosystems & Habitats / Oceans & Seas
BISAC NAT045030 Ecosystems & Habitats / Polar Regions
BISAC SCI081000 Earth Sciences / Hydrology
BISAC SCI092000 Global Warming & Climate Change
BISAC SCI020000 Life Sciences / Ecology
BISAC SCI039000 Life Sciences / Marine Biology
BISAC SOC053000 Regional Studies
BISAC TEC060000 Marine & Naval
The dissolved oxygen, COD (Chemical Oxygen Demand) and DIN (Dissolved Inorganic Nitrogen) data for more than 30 years in the inner area of Ariake Sea, Japan were analyzed with a box model. The bottom water in this area easily became hypoxic from the 1970s to the early 90s associated with the increase in COD. There were minimal increases in terrestrial COD and nutrient loads in this period and there remained tidal flats over a widespread area. The increase in COD was caused by the increase in internal production (net ecosystem production in the sea). This would be due to the enhanced primary production induced by the increase in freshwater residence time and the decrease in bivalves grazing. The increase in freshwater residence time would have been caused by the decline of tidal amplitude mainly generated by the decrease of outer sea tidal amplitude. There would be a negative feedback control where hypoxia tends to progressively increase leading to declines in bivalve biomass which subsequently remove grazing pressure limiting primary production and on senescence of blooms of phytoplankton enhances hypoxia. The possibility of the influence of the Isahaya sea dike construction and how to improve the hypoxic conditions are also discussed.
dissolved oxygen, COD, box model, Ariake Sea, bivalve
I. INTRODUCTION
The depletion of dissolved oxygen (DO) and the development of hypoxic condition in semi-enclosed seas is a serious environmental problem since it induces the decrease in benthos and fish biomass and alters the material cycling (e.g. Diaz and Rosenberg, 1995). In the inner area of Ariake Sea, hypoxia occurs every summer now. Since it induced massive kills of bivalves (e.g. ark shell Scapharca kagoshimensis), it became a big problem (Okamura et al., 2010). However, the reasons why hypoxia has progressed over several decades remain unknown. The amounts of nutrients loaded into Ariake Sea from the coastal land areas via major rivers have increased little over the past two decades (Tsutsumi et al, 2006). Also there are widespread tidal flats which accounts for 40% of total tidal flat area in Japan remaining in Ariake Sea. Therefore, there would be a mechanism that is different from the many eutrophicated bays where the increase in terrestrial loads of nutrients and landfill has induced the progress in eutrophication, e.g. Chesapeake Bay (Kemp et al, 2005), Seto Inland Sea (Takeoka et al., 2005), Ise Bay and Mikawa Bay (Ishida and Hara, 1996).
The increase in oxygen consumption by organic matter decomposition is one of the generation mechanisms for the long term increase in hypoxia in semi-enclosed bays. Kodama et al. (2009) demonstrated that the contribution of oxygen consumption by particulate organic matter, especially originated from the marine phytoplankton, plays an important role for the formation of hypoxia in the inner area of Ariake Sea. In the inner area of Ariake Sea, the monitoring of the Chemical Oxygen Demand (COD) in water has been carried out for the index of the concentration of the organic matter since the 1970s. Therefore, in order to clarify the long term variation in the bottom DO in summer and to understand the mechanism of the variation, I analyzed the historical records of the bottom DO, COD and dissolved inorganic nitrogen (DIN) in the inner area of Ariake Sea. For this purpose, I calculated the change over 30 years of the budgets of COD and DIN.
II. DATA AND METHODS
Temperature, salinity, DO and COD measurements were made monthly at 11 stations by the Saga Prefectural Ariake Fisheries Research and Development Center from 1972 to 2014 in the inner area of Ariake Sea (Fig. 1). Data were taken at the surface and 1 m above bottom or surface, 5 m and 1 m above bottom. I used these data for the investigation of the long term change in hypoxia. The bottom DO in the inner area of Ariake Sea in summer fluctuates largely affected by the variation in stratification caused by the river discharge (Ishitani et al., 2007). Therefore, in order to remove the effect of the variation in stratification, I calculated DOs which is a potential of hypoxia using the method by Hayami et al. (2006).
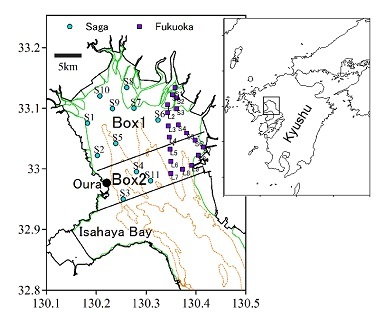
In order to calculate the budgets of COD and DIN, salinity, COD and DIN data taken at 11 stations by the Saga Prefectural Ariake Fisheries Research and Development Center and at 9 to 18 stations by the Fukuoka Fisheries and Marine Technology Research Center Ariake-Sea Laboratory from 1981 to 2014 were used (Fig. 1). Data were taken at the surface and 1 m above bottom or surface, 5 m and 1 m above bottom monthly. Also, the river discharge and riverine input of COD through the 4 class A rivers (Chikugo, Yabe, Kase and Rokkaku rivers) flow into the inner area of Ariake Sea were used. As the river discharge and COD loads, the dataset by Tezuka et al. (2013) and supplement until 2014 were used. To calculate the budgets, I made a box model analysis for COD and DIN in the inner part of the Saga and Fukuoka waters (Fig. 1). The dates of observations by Saga and Fukuoka prefectures were not always the same. Therefore, I made a box model analysis for the average field during 11 consecutive years. At first, the water exchange flux between box 1 and box 2 were estimated based on the salt budget for box 1 (equation (1)). The evaporation and precipitation were neglected since they were small compared to the river discharge.
.jpg)
Here, S1 and S2 are the mean salinity of every month in box1 and box 2 respectively. V is the volume of box 1. Q is the river discharge. q is the water exchange between box 1 and 2. Using q, river discharge, riverine input of COD and the average COD in box 1 and 2 during 11 consecutive years, I calculated the COD budget for box 1 (equation (2). From this calculation, I got the internal production of COD in box 1.

Here, C1 and C2 are the mean COD of every month in box 1 and box 2 respectively, L is the riverine input of COD and R is the internal production in box 1. R is the balance between the organic matter production by algae and the consumption of organic matter by grazers and bacteria. Using the same equation (2), the internal production of DIN was also calculated.
Furthermore, the tidal level data monitored every hour at Oura by the Japan Meteorological Agency was used for the analysis. The amplitudes of M2, S2, K1, O1, M4, MS4, S4, N2, MU2 and Q1 constituents were estimated by the harmonic analysis for every year. The amplitudes of major 4 constituents (M2, S2, K1, O1) were used for the analysis.
III. RESULTS
The DOs in the Saga waters in July decreased from the 1970s to the early 90s then recovered slightly (Fig. 2). The 11 year running mean of COD in the bottom water in July increased from the 70s to the early 90s then decreased slightly (Fig. 2). There was a strong negative correlation between them (r=-0.94).
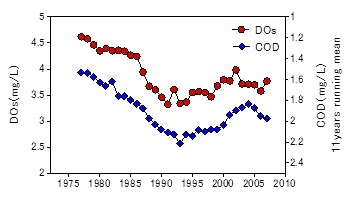
Fig.2. Variatiosn in DOs and 11 year running mean of COD.
There were two peaks (in summer and winter) in the average seasonal variation in COD in box 1 (Fig. 3). The riverine input of COD peaked in July. The COD fluxes by advection and water exchange were always negative indicating that the bay head of Ariake Sea was the source of COD. The internal production was negative only in July. This would be caused by the organic matter consumption exceeded the internal production by algae since there was a large terrestrial input in July. Beside July, the internal production of COD was always positive. It indicated that the bay head of Ariake Sea was a net source of COD.
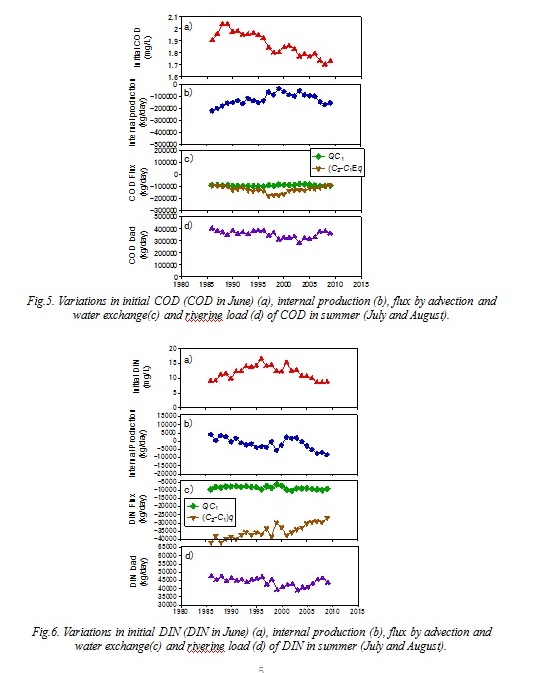
The results of the box model analysis shows multi-decadal variations in COD and DIN budgets. Fig. 4 shows the variation in average COD in box 1 in July and August. They increased during the 80s and the early 90s similar to the bottom water COD in Saga waters. The internal production of COD (net COD production in box 1) in summer (July and August) was always negative throughout the study period (Fig. 5). It indicated that the bay head of Ariake Sea was a net sink for COD in summer. The internal production of COD increased in the 80s and the 90s and peaked in 1999. On the other hand, the riverine COD load and advective flux of COD in summer remained almost at the same level in this period. The COD load decreased in the early 2000s then recovered. The COD flux from box 1 to box 2 by water exchange in summer increased in the 80s and the 90s then decreased. The internal production of DIN (net DIN production in box 1) in summer decreased during the 80s and the 90s. It once recovered in the 2000s, then decreased again (Fig. 6). Until the early 80s, the internal production of DIN was positive. It indicated that the nitrogen recycling was larger than the consumption. However, it became negative after the mid 90s,
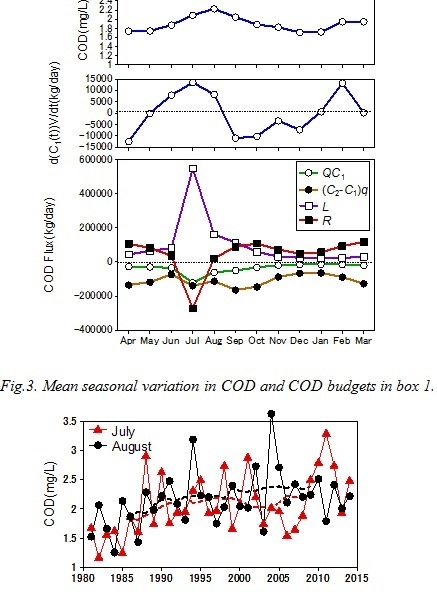
Fig.4. Variations in average COD in box 1 in July and August. Broken lines shows the 11 year running mean.
IV. DISCUSSION
The bottom water in the inner area of Ariake Sea became hypoxic when stratification was enhanced in summer (Hayami, 2007; Hamada et al., 2008). The long term decrease in DOs indicated that the inner area of Ariake Sea readily became hypoxic from the 70s to the early 90s. The negative correlation between DOs and COD suggests that the decrease in DOs would be caused by the increase in organic matter in the bottom water.
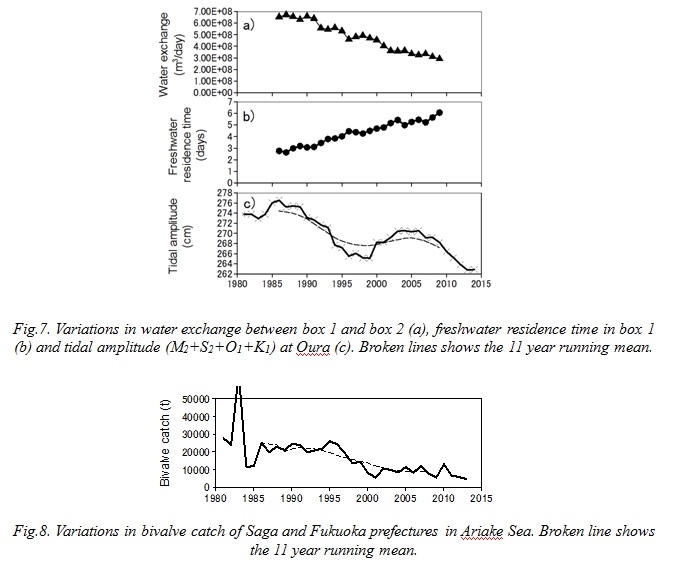
The summer COD in box 1 increased in the 80s and the early 90s. There are 4 potential reasons for the increase, 1) increase in the initial value (COD in June), 2) increase in the internal production, 3) decrease in the fluxes by advection and water exchange and 4) increase in riverine input. The initial value increased from 1986 to 1988 but then decreased (Fig. 5). Therefore 1) is not the main reason. The COD flux by water exchange in summer decreased and the advective flux remained almost at the same level. Therefore 3) can be considered as negligible. Since the riverine load of COD in summer remained almost at the same level, 4) can be also considered as negligible. On the other hand, the internal production of COD in summer increased. This means that the organic matter production in the sea increased or the consumption by the grazers and/or bacteria decreased. The longer freshwater residence time enhances the primary production in the semi-enclosed bay (Yanagi and Yamada, 2000). Since the residence time of the freshwater in box 1 (t) increased by 45% between 1986 and 1995 (Fig. 7), it would enhance the primary production in box 1.

Moreover, the catch of bivalves in Saga and Fukuoka prefectures decreased in the same period (Fig. 8). And also, there were oyster reefs of an area of 546 ha in the inner area of Ariake Sea in 1977, but it decreased to 161 ha now since they were removed for the fishery ground improvement (Fisheries Research Agency and Saga University, 2012). These facts indicate that a decrease in grazers activity occurred. Yoshino et al. (2010) indicated that the macrobenthos biomass in the inner area of Ariake Sea in summer decreased caused by the stress of hypoxia. These results suggest a negative feedback control where the decrease in bivalves which removes grazing pressure limiting the phytoplankton production leads the increase of organic matter in the bottom water. The increase of organic matter would lead further decline of the bottom DO which raise more damage on the benthos. There is another mechanism for the increase in the internal production. As I mention later, the tidal amplitude has declined during the past 30 years in Ariake Sea. This will lead to a decrease the resuspension of bottom sediments and organic matter. The reduced resuspension would decrease the decomposition of organic matter. Hereafter, these hypotheses should be confirmed with a precise ecosystem model.
The water exchange between box 1 and box 2 decreased and the freshwater residence time increased throughout the study period (Fig. 7). Yanagi and Abe (2005) suggested that the water exchange of the inner area of Ariake Sea declined caused by the decrease of the tidal amplitude during the 1990s. Tai et al. (2010) indicated that the M2 tidal amplitude in Ariake Sea decreased and the most influential factor was the decrease of outer sea tidal amplitude. The 11 year running mean of the major 4 tidal amplitudes at Oura decreased during the past 30 years (Fig. 7c). They suggest that the long term decline of the tidal amplitude slowed the water exchange between box 1 and box 2 and enhanced the freshwater residence time, which was mainly caused by the decrease of outer sea tidal amplitude. Hereafter, it should be confirmed with a three dimensional hydrodynamic model.
Isahaya Bay is a subembayment of Ariake Sea located on the western coast (Fig. 1). The inner 1/3 of Isahaya Bay was shut off from the sea by the sea dike in 1997 for reclamation and disaster prevention. It has been discussed that this sea dike construction was related to the water quality change in the inner area of Ariake Sea (e.g. Matsukawa et al., 2014). If the dike construction influenced on the DIN or COD dynamics in the inner area of Ariake Sea, the effect would be revealed in the time series of the water exchange fluxes or the internal productions. The COD flux by water exchange peaked in 1997, then it decreased. There was no similar variation in DIN. This change in COD flux can be explained by the continuous decrease in water exchange and the decrease in internal production and terrestrial input. Until 1997, the water exchange between box 1 and box 2 decreased continuously. However, since it was compensated for by the increase in internal production in box 1, the COD flux by water exchange from box 1 to box 2 increased. After 1997, the water exchange still decreased, but the increase in internal production stopped and the riverine COD load decreased. Therefore, the COD flux by water exchange between box 1 and box 2 decreased after 1997. As I show above, the decrease in water exchange was mainly due to the decrease of outer sea tidal amplitude. The internal production of COD peaked in 1999 then the increase stopped. At the same time, the internal production of DIN increased. This suggest that the primary production decreased.
Finally, I refer to how to improve the hypoxia. As we mentioned above, one of the reasons for the progress of hypoxia would be the decrease of bivalve biomass. The recovery of the bivalve biomass will decrease the phytoplankton and improve the hypoxic condition. However, if the bivalves were killed by hypoxia, it would enhance the hypoxia. Therefore, the recovery of bivalves should be applied to the top of the water column where the hypoxic water does not affect. For this purpose, the recovery of oyster reef is suitable. Yamaguchi et al. (2015) showed that if the oyster biomass became two times larger than the present state, the volume of the hypoxic water mass in the inner area of Ariake Sea would decrease by up to 20%. If this can generate a positive feedback where the improvement of hypoxia leads to an increase in bivalve biomass, it may produce a greater effect.
V. Acknowledgment
I thank the Saga Prefectural Ariake Fisheries Research and Development Center and the Fukuoka Fisheries and Marine Technology Research Center Ariake-Sea Laboratory for providing the monitoring data. I also thank Prof. Koichiro Ohgushi for providing the data set of river discharge and terrestrial loads and Mr. Shusaku Ohta for supporting data collection.
1. R. J. Diaz and R. Rosenberg, “Marine benthic hypoxia: A review of its ecological effects and the behavioural responses of benthic macrofauna,” Oceanogr. Mar. Biol., Annu. Rev., 33, pp. 245-303, 1995.
2. Kazumaro Okamura, Katsuhisa Tanaka, Katsunori Kimoto, Takayasu Fujita, Yuichiro Mori and Yoko Kiyomoto, “Effects of oxygen deficient water and properties of surface sediments on the mass mortalities of the ark shell (Scapharca kagoshimensis) in the northwestern part of Ariake Bay,” Bull. Jpn. Soc. Fish. Oceanogr., 74(4), pp. 197-207, 2010.
3. Hiroaki Tsutsumi, Chizuko Kimura, Sayaka Nagata, Masanori Tsukuda, Hitomi Yamaguchi, Tohru Takahashi, Shigenobu Kimura, Masao Tachibana, Toshimitsu Komatsu and Shigeru Montani, “Mechanisms causing frequent large-scale red tides in inner areas of Ariake Bay,” Oceanography in Japan, 15(2), pp. 165-189, 2006.
4. W. M. Kemp, W. R. Boynton, J. E. Adolf, D. F. Boesch, W. C. Boicourt, G. Brush, J. C. Cornwell, T. R. Fisher, P. M. Glibert, J. D. Hagy, L. W. Harding, E. D. Houde, D. G. Kimmel, W. D. Miller, R. I. E. Newell, M. R. Roman, E. M. Smith and J. C. Stevenson, “Eutrophication of Chesapeake Bay: historical trends and ecological interactions,” Marine Ecology Progress Series, 303, pp. 1-29, 2005.
5. Hidetaka Takeoka, Yuichi Hayami and Atsushi Kaneda, “Long-term variation in the marine environments of the Seto Inland Sea,” Bulletin on Coastal Oceanography, 43(1), pp. 45-50, 2005.
6. Motoo Ishida and Tamotsu Hara, “Change in water quality and eutrophication in Ise and Mikawa Bay,” Bulletin of Aichi Fisheries Research Institute, 3, pp. 29-41, 1996.
7. Masashi Kodama, Takahisa Tokunaga, Katsunori Kimoto and Yoshikazu Shibahara, “Primary production and decomposition dynamics of particulate organic matter in the inner part of Ariake Bay,” Journal of JSCE Ser. B2 (Coastal Engineering), 65(1), pp. 1006-1010, 2009.
8. Tetsuhiro Ishitani, Masahiro Seguchi, Masumi Koriyama and Osamu Kato, “Occurrence of hypoxic water and density stratification in the western interior parts of Ariake Sea,” Trans. of JSIDRE, 247, pp. 65-72, 2007.
9. Yuichi Hayami, Koichi Yamamoto, Koichiro Ohgushi, Takaharu Hamada, Ryu-ichi Hirakawa, Hitoshi Miyasaka and Koji Omori, “Transport of suspended matters and its implications for water quality in the inner area of Ariake Sea in summer,” Proceedings of Coastal Engineering, JSCE, 53, pp. 955-960, 2006.
10. Masahiro Tezuka, Koichiro Ohgushi and Naoto Ogata, “Estimate of long-term variation of inflow loads and the effect of inflow discharge on red tide in the Ariake Sea,” J. Jpn. Soc. Civ. Eng. B1, 69 (4), pp. 1735-1740, 2013.
11. Yuichi Hayami, “Hypoxic water mass in the inner area of Ariake Sea,” Aquabiology, 173, pp. 577-583, 2007.
12. Takaharu Hamada, Yuichi Hayami, Koichi Yamamoto, Koichiro Ohgushi, Kenji Yoshino, Ryuichi Hirakawa and Hiroki Yamada, “Serious hypoxia in the head of the Ariake Sea in summer, 2006,” Oceanography in Japan, 17 (5), pp. 371-377, 2008.
13. Tetsuo Yanagi and Machiko Yamada, “Reason why red tide do not occur during winter in Dokai Bay, Japan,” Oceanography in Japan, 9 (3), pp. 125-132, 2000.
14. Fisheries Research Agency and Saga University, Report of the investigation for a plan to restore the ecosystem of Ariake Bay, Japan (Evaluation of ecological functions of bivalves), Fisheries Research Agency, 2012.
15. Kenji Yoshino, Takaharu Hamada, Koichi Yamamoto, Yuichi Hayami, Souichi Yamaguchi and Koichiro Ohgushi, “Effects of hypoxia and organic enrichment on estuarine macrofauna in the inner part of Ariake Bay,” Hydrobiologia, 652, pp. 23-38, 2010.
16. Tetsuo Yanagi and Ryohei Abe, “Year-to-year variations in salinity and the budgets of dissolved inorganic phosphorus and dissolved inorganic nitrogen in the head of Ariake Bay,” Oceanography in Japan, 14 (1), pp. 21-33, 2005.
17. Akira Tai, Kodai Sakai, Tomonori Saita, Akihiro Hashimoto, Shinichiro Yano, Akihide Tada and Toshimitsu Komatsu, “Long-term change of semidiurnal tide in the Ariake Sea and the Yatsushiro Sea,” Annual journal of Hydraulic Engineering, JSCE , 54, pp. 1537-1542.
18. Yasuo Matsukawa, Katsuyuki Sasaki and Yozo Hanyu, “Casuality between hypoxia of Ariake Sea environment and reclamation in Isahaya Bay, Japan,” Oceanography in Japan, 23 (3), pp. 87-110, 2014.
19. Souichi Yamaguchi, Yuichi Hayami and Katsunori Kimoto, “Inhibition effect of oyster reef on occurrence of hypoxia in Ariake Sea,” Bulletin on Coastal Oceanography, 53 (1), pp. 25-38, 2015.


