


BISAC NAT010000 Ecology
BISAC NAT045050 Ecosystems & Habitats / Coastal Regions & Shorelines
BISAC NAT025000 Ecosystems & Habitats / Oceans & Seas
BISAC NAT045030 Ecosystems & Habitats / Polar Regions
BISAC SCI081000 Earth Sciences / Hydrology
BISAC SCI092000 Global Warming & Climate Change
BISAC SCI020000 Life Sciences / Ecology
BISAC SCI039000 Life Sciences / Marine Biology
BISAC SOC053000 Regional Studies
BISAC TEC060000 Marine & Naval
The work is devoted to solving the problem of radon mapping of the Taman peninsula as a problem of interaction between the region’s ecosystems and population. An express method of calculating the radon volumetric activity for decay energy of secondary products designed and implemented. Data of the 3-year's field investigations allowed us to plot the map of distribution of radon volumetric activity in the coastal zone of the Azov and Black seas of the Taman Peninsula, as well as over its surface. Some potentially dangerous territory identified. Average values of radon volumetric activity determined in the zones of tectonic disturbances and for the main territory of the Taman.
Taman peninsula, radon, radon volumetric activity, Black sea, Azov sea.
I. Introduction
The stress-strain state of the earth's surface for Taman region is well known. More than ten hectares of new land that were bottom of the Sea of Azov had emerged in the night of 29 to 30 April 2011(Fig. 1) [1].
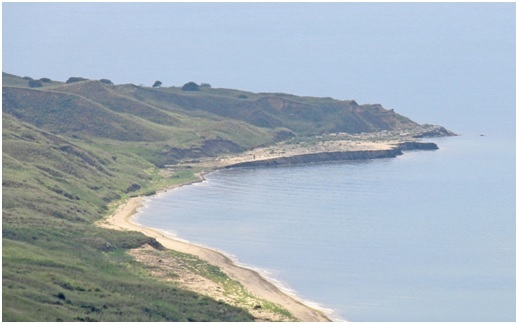
Fig. 1. The cape of Kamennyi. Neotectonic lifting.
The observations showed, that the rise of the seabed caused by the deformation of anticlinal folds, so far as the elevation was formed from bedrock. The rocks have undergone significant deformation and outcropped on the surface of the elevation under the angle to 800 (Fig. 2).
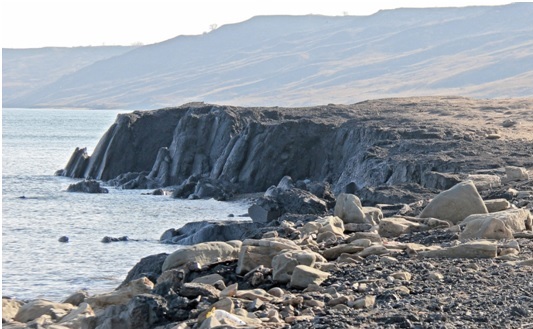
Fig. 2. The cape of Kamennyi. Fragment of lifted seabed.
Measurements of radon volumetric activity in overground layer of air have shown values up to 80,000 Bq/m3 (possible a maximum value is 150 Bq/m3) [2].
Territory of the Taman peninsula densely populated. Identifying the possible radiation exposure, decay products of radon to the population became the reason for radon hazard mapping of the Taman Peninsula territories.
II. Radon
Before proceeding to the presentation of research data, it is necessary to give some information about radon. It is important to understand the reason of choice a radon isotope (222Rn) for further argument.
Radon is a radioactive gas without color and odorless. It is heaviest element of the zero group of periodic system. Radon is the only noble gas that does not have stable and long-lived isotopes. It has three natural isotopes.
Radon 222Rn
The most stable isotope of radon that is part of the family of uranium 238U and a direct product of the radium 226Ra decay. Usually, the name of "radon" has assigned to this isotope. It has a half-life of hours 91.764 (3.8235 days). Ninety seven percent of the isotope will decay after 960 hours (20 days).
Thoron 220Rn
Thoron has opened in 1900. It has integrated to the chain of radioactive elements decay of the thorium (232Th) family. Thoron is product of the radium 224Ra decay. Thoron has a half-life 54.5 s. Ninety seven percent a thoron decay lays in 285.079 s.
Actinon 219Rn
Actinon has opened in 1903. It included in the family of uranium 235U. Actinium (227Ac) and radium isotope (223Ra) are existence in the decay chain of uranium (235U). Actinon is the shortest-lived natural isotope. It has a half-life 3.92 s. Ninety seven percent decay lays in 20.505 s.
In Fig. 3 shows the transformations series of the uranium and thorium radioactive families until the formation of the radon isotopes.
.jpg)
Isotopes of radon, the decay emitting alpha particles, do transformation to solid radioactive isotopes of polonium, lead and bismuth, referred to as "active bloom". The decay products are metals and not relate to the group of inert gases. The linear dimensions of free metal atoms are units of nm. They are not able to stay long in the atmosphere in a free state. In contact with the non-radioactive aerosols, they form radioactive aerosols, sizes of which are increase by several orders of magnitude.
The simplified decay chains of radon isotopes are showing in Fig. 4.
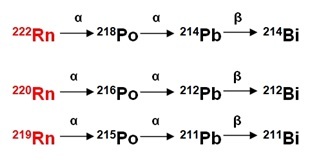
Fig. 4. Simplified decay chains of radon isotopes.
As can be seen from the diagram, the decay products of radon are the secondary alpha and beta emitters.
Radon is emitting in excessive amounts during the tectonic deformations. Increased volumetric concentration of radon in the air is an indicator of tectonic faults presence, which penetrate to depths of tens kilometers. Monitoring the background of radon been used to forecast changes in the stress-strain state of the earth's crust. The physical properties of the radon isotopes (the time of life, in particular) have shown, that the emanation of thoron and actinon not able migrate to appreciable distances from the nuclei-precursors. Therefore, in all our reasoning under volumetric activity of radon, means the volumetric activity of radon isotope 222Rn, a decay chain that includes isotopes 218Po, 214Pb and 214Bi.
III. Field investigations
The field investigation has begun in the spring of 2011 at the Taman peninsula, immediately after the April events at the cape of Kamennyi.
During the spring and summer, 2011, been detected a number of other anomalies at the Taman peninsula.
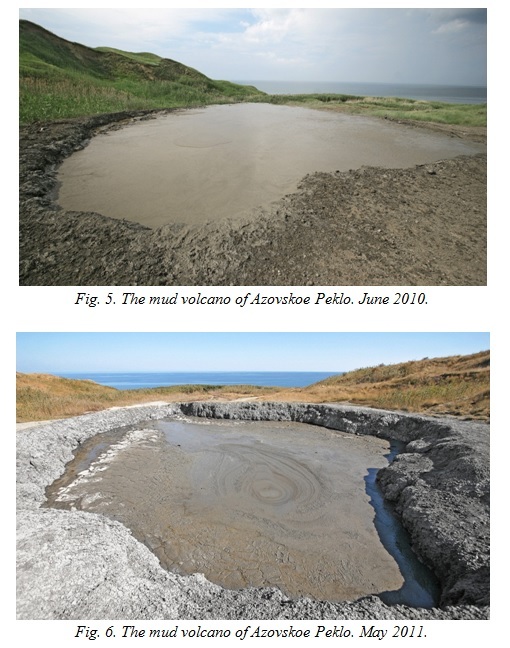
The cape of Peklo and the Azovskoe Peklo mud volcano
The volcano been situated about 5 km to East from the cape of Kamennyi. The mud surface of volcano has down significantly relatively to the sea level. The mud disappeared of it. Fig. 5 and Fig. 6 show, respectively, the state of the volcano in 2010, and after lifting of the plate (in May 2011).
The mud volcano of Rotten Mountain
The volcano been situated about 40 km to Southeast from the cape of Kamennyi. Mud stream up to a width of 15 m was flowing out of a volcano during 2 months after the tectonic shifts of 2011 (Fig. 7). That is, this area of Earth's surface came down. A lot amount of dirt been squeezed from the deep layers.
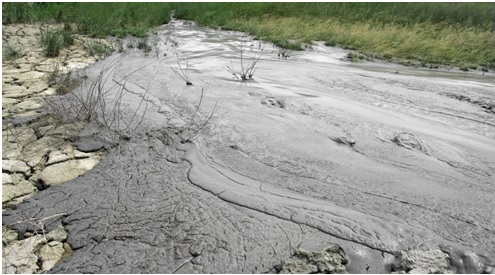
Fig. 7. The mud volcano of Rotten Mountain. Fragment of mud stream. May 2011.
The mountain of Carabetka
At the Eastern slope of the mountain of Carabetka (about 30 km to South of Kamennyi cape) intensified mud volcano (Fig. 8) at the point, marked on topographic maps 2006 as a spring.
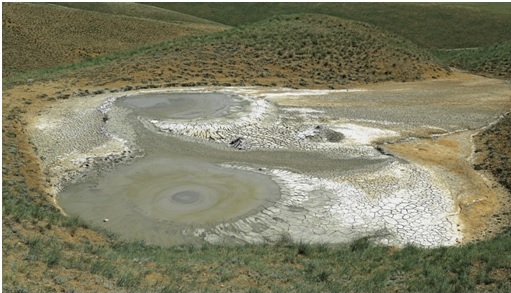
Fig. 8. A mud volcano at the Eastern slope of the mountain of Carabetka.
All this suggests that in 2011 the tectonic activity at the Taman region was not local. Numerous areas of the peninsula been affected.
According to our hypothesis [1], these processes could occur as the echo of the Tohoku earthquake. The events occurred in the following sequence. 9-point earthquake occurred in Tohoku on March 11, 2011. By data [3] of "United States Centre earthquakes monitoring", motion of the crust spread across the globe with a high velocity (Fig. 9).
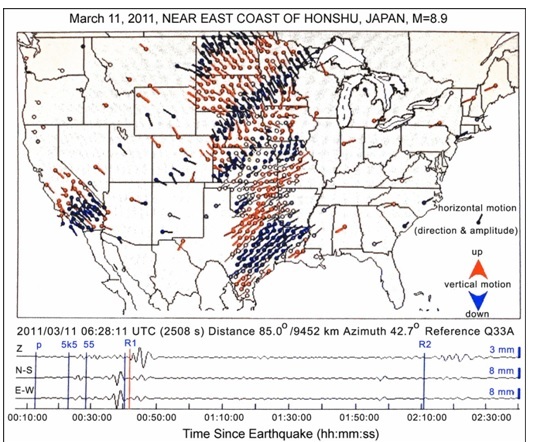
Fig. 9. Two and half hours fragment of the Earth's surface motion at the territory of United States from the moment of the earthquake occurrence in Tohoku.
The maximum amplitude of the Earth's surface oscillations in the Taman region exceeded background in 70 times [4] (Fig. 10).
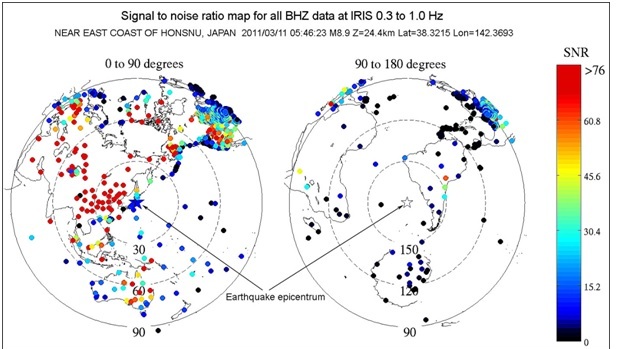
Fig. 10. Map of the dissemination of the Earth's surface motion across the globe from the epicenter, in the frequency range of 0.3 – 1.0 Hz. The points on the map are seismic stations.
The analysis of findings of investigations helped to bind the events to the model of Lawrence [5], according to which the processes of stretching and compression of the earth's surface during the earthquake (and resonance phenomena) have brought to rise of anticlinal folds. Deformation of the anticlinal folds have revealed in the form of described anomalies.
Anomalies of 2011 year have convinced us of the need for studies of Taman peninsula's radon potential. In the first phase has implemented method of laboratory analyzing of samples, selected in the process of field investigations. High complexity of method has not allowed doing detailed mapping of the studied area. For investigations has designed and implemented express- method of calculating the radon volumetric activity by energy of secondary products decay [6]. Radon mapping of Taman peninsula studied territories, carried out by this method.
IV. Results of field investigations
In the Fig. 11 shown designed map of radon volumetric activity above the surface of Taman peninsula. The data is valid for the 0-3 m overground layer of air, for spring-summer period of years 2013-2015.
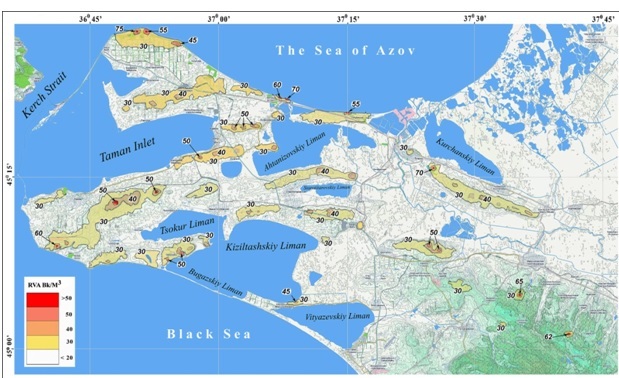
Fig. 11. The map of radon volumetric activity (RVA) above the surface of Taman peninsula.
Map shows, high values of radon concentration focused along the anticlinal structure of have been investigated areas.
In numerical terms, the average statistical data are as follows.
- In a "quiet" period, the radon volumetric activity, for the 0-3 m overground layer of air, lays in range 12-20 Bq/m3.
- The values of radon volumetric activity rise to 100 Bq/m3 in zones of tectonic deformation.
- During extreme events, like described above, the values of radon volumetric activity greater than 10000 Bq/m3.
It should note, on the obtained values of radon concentrations has superimposed of seasonality influence.
The place of neotectonic lifting been monitored during three years. It gives possibility to calculate the indicator of earthquake "maturation" for the anticline of the Kamennyi cape. It is 35-40 years. Next critical year will about 2048.
V. Conclusions
The newly formed structures, emergent as result of discharge tectonic stresses, are indicators of the potential danger of a complex geological structure of the earth strata in the region. Accordingly, the monitoring of radon situation is the actual problem.
Evaluation of radon hazard of Taman peninsula territories produced for the first time. Designed map of radon volumetric activity above the surface of Taman peninsula will guide for the choice of business activities locations.
The express- method of calculating the radon volumetric activity by energy of secondary products decay can recommend for operational radiological environmental monitoring, forecasting and liquidation of contamination.
Ongoing studies are of particular importance in the aspect of modern problems of ecological safety at the Azov-Black seacoasts of Russia.
VI. Acknowledgment
Researches accomplished under the financial support of the Russian Scientific Foundation, project No 14-17-00547.
1. I.S. Podymov, T.M. Podymova, “Anomalous Natural Phenomenon at the Coastal Zone of Azov Sea,” Global Congress on ICM. Lessons Learned to Address New Challenges. Proceedings of EMECS 10 Medcoast 2013 Joint Conference, Ankara, Turkey: Bizim Dijital Matbaa, 2013, vol. 1, pp. 655-664.
2. I.S. Podymov, T.M. Podymova, “Research of radon flux density from water and ground surfaces of the Taman peninsula,” Proceedings of International workshop “Ecology of the coastal zone of inland seas”, Gelendzhik: Intertekhnologii, 2014, pp. 41-49.
3. “The USArray GMV for M 8.9 Near East Coast of Honshu, Japan,” http://www.ds.iris.edu/spud/gmv/4841
4. “Signal to noise ratio map for all BHZ data at IRIS 0.3 to 1.0 Hz,” http://www.ds.iris.edu/spud/eventplot/650555
5. W. Braile Lawrence, “Seismic Waves and the Slinky: A Guide for Teachers,” http://www.web.ics.purdue.edu/~braile/edumod/slinky/slinky.pdf
6. I.S. Podymov, T.M. Podymova, “Rapid method for investigations of radon volume activity above the earth’s surface,” Joint Conference “Solutions to the problems of preservation and restoration of the beaches of the Crimean Peninsula”, Sevastopol: MGI RAS, 2015, pp. 68-69.