


BISAC NAT010000 Ecology
BISAC NAT045050 Ecosystems & Habitats / Coastal Regions & Shorelines
BISAC NAT025000 Ecosystems & Habitats / Oceans & Seas
BISAC NAT045030 Ecosystems & Habitats / Polar Regions
BISAC SCI081000 Earth Sciences / Hydrology
BISAC SCI092000 Global Warming & Climate Change
BISAC SCI020000 Life Sciences / Ecology
BISAC SCI039000 Life Sciences / Marine Biology
BISAC SOC053000 Regional Studies
BISAC TEC060000 Marine & Naval
Research on individual variation of the filtration and growth rates of mussels was based both on the authors’ field and laboratory experiments and literature data analysis. High individual variability of these characteristics was recorded during the tests. The coefficient of variation grew up as the mean rate diminished. Under low specific growth rate the coefficient of variation (ratio of root-mean-square deviation to the sample mean) could exceed 100 %. Tests revealed the power-law relation of the coefficient of variation from the average for studied characteristics. That relation could be seen in filtration and growth rate charts; it was also true for estimates of production energy and metabolic costs. The exponent varied from -0.36 to -0.77. Individual growth rate variation of mussels was concluded to be an important criterion of the favorability of environmental conditions.
clearance rate, laboratory experiments, mariculture, Bivalvia.
I. Introduction
Individual variation of living organisms can be regarded from different aspects: like an individual variation of a specimen, revealed in the process of its functioning and ontogenesis; like differences between specimens relatively close or genotypically identical or like manifestation of diverse differences between specimens of the same family, genus, and species in similar conditions. In the latter case, individual variation is an indefinite variation based on inherited differences between individuals which are essential for the evolutionary process [1].
The present paper is dedicated to the indefinite individual variation of some functional characteristics of mussels Mytilus galloprovincialis Lam., namely the growth and filtration rates. Physiological processes of mussels are known to depend on a lot of ambient conditions. M. galloprovincialis is an eurybiont that lives in various biotopes of the
There are only a few works concerning individual variation of filtration rate, linear and weight rate of mussels [6 – 9]. In this study we investigated individual variation of the functional characteristics of mussels based on the literature data and our own observations.
II. Materials and methods
Individual variation of the growth rate
In 2008 and 2015 we carried out natural experiments to estimate individual linear and weight growth rates of mussels. Each experimental mussel was indexed by a metal stylet. We measured linear parameters of a specimen by the digital caliper and total wet weight by the laboratory balance «Sartorius». As an indicator of individual variation we used the coefficient of variation CV that was calculated as the ratio of the standard deviation to the average, in other words, the relative dispersion of measured growth rates.
In 2008 experiment mussels were located in a shallow-water layer at the top of
From June till November 2015 cages with mussels were located in
Individual variation of the filtration rate
Series of experiments were performed to measure the individual filtration rate of mussels, which was estimated by the amount of water cleared from particles per unit of time. Five samples of mollusks with similar length parameters were selected from natural populations. The size ranges within groups were: 12-
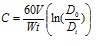 ,
,
Where C (l∙h-1) – filtration rate, D0 and Dt – initial and final seston concentration (g∙l-1), t – time of exposition in minutes, W – weight of mussels (g). Water temperature in the experiment varied in a range 23 – 26 °С. Then we used data from [6, 8, 9] to analyze the published results of measurements of growth, filtration and oxygen consumption rates of mussels.
III. Results and discussion
During the experiments in 2008 growth rates of 15-
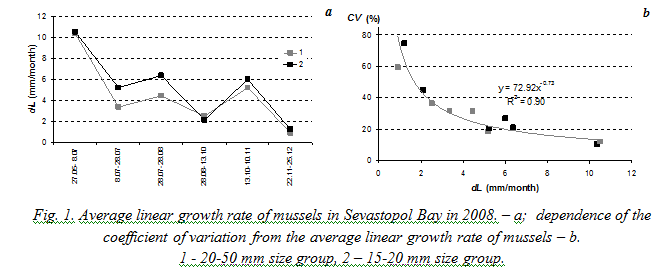
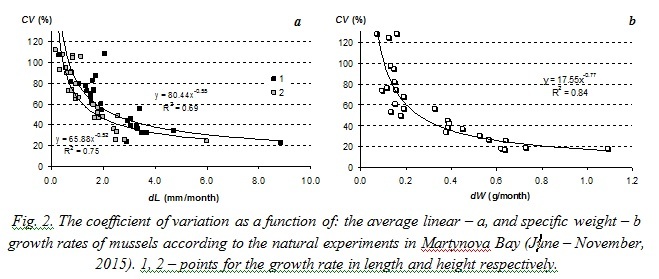
Fig. 2 demonstrates dependence of the coefficient of variation from the average linear and weight growth rates of mussels based on the results of experiments in
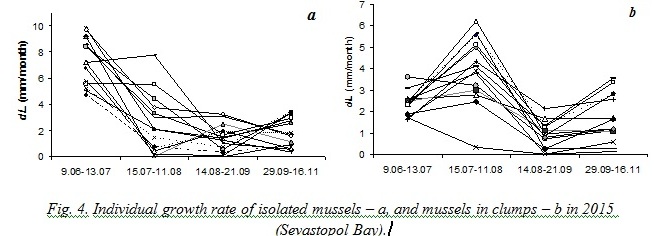
Results obtained during natural experiments in 2008 and 2015 helped us to trace an individual growth of different mussels. Fig. 3 demonstrates that some specimens remarkably slowed down their growing when the average growth rate of the sample increased and vice versa.
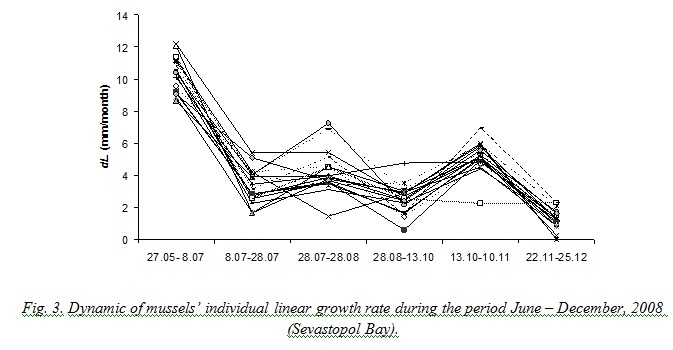
On one hand, such changes of individual growth rates of mussels in clumps could have been explained by peculiarities of their positions that were changed at the end of every period of observations. On the other hand, comparison of mussels’ growth in 2015 has revealed that the opposite sign changes of the growth rate have been demonstrated both by isolated and aggregated mussels. Moreover, in some periods changes of growth with opposite sign were more strongly marked for isolated mussels (fig. 4).
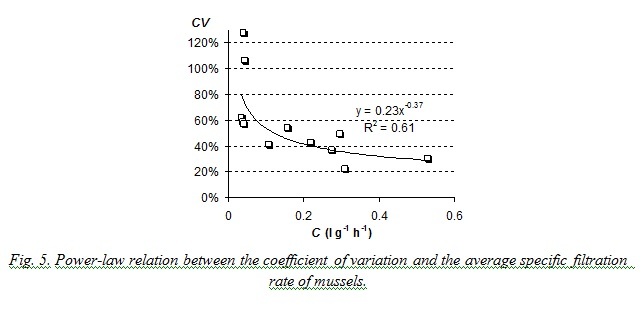
Laboratory studies on filtration rates also prove that the coefficient of variation decreases when mean value of the characteristic increases. Results are presented on Fig. 5. The coefficient of variation of filtration rate in performed studies was generally more than 30% and could reach 120%. Such great variation of this characteristic was obviously the result of such unfavorable ambient conditions as high water temperature and high concentration of algae in suspension (0.015 – 0.017 g∙l-1).
Similar power-law relations between variation coefficients and average values of the functional characteristics were obtained from the analysis of published results on specific filtration rate of Dreissena polymorpha mussels [8] and growth rates of
.jpg)
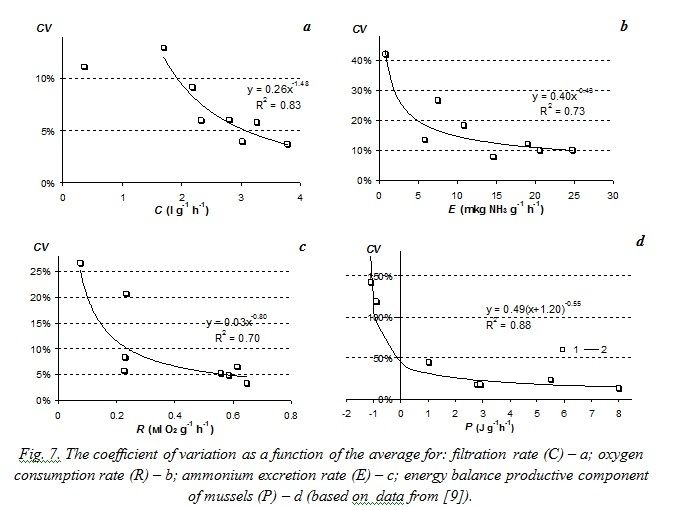
The paper [9] presents estimated statistic characteristics of M. edulis mussel energy balance components. Studied mussels were got from natural populations at Langesund Fjord in
IV. Conclusion
Conducted experiments showed high individual variation of studied characteristics of M. galloprovincialis reaching 120% under low average values. We revealed power-law dependence of the coefficient of variation on average not only in filtration and growth rates data, but also in estimates of productive and metabolic energies. Individual variation level of mussels’ growth rate can indicate whether environment conditions are favorable for them. When the average rate decreases the sample becomes inhomogeneous in functional characteristics because individual variation rises sharply. It can be explained by the fact that under unfavorable conditions mussels with better adaptive abilities demonstrate comparatively high growth rate, whereas other mollusks slow down their growth or die out. When ambient conditions become favorable again, mollusks demonstrate similar high growth and filtration rates, so the sample becomes again homogeneous in functional characteristics of a specimen. This conclusion should be taken into account while planning field studies and experiments, selection studies and mathematical simulation of mussel farm functioning.
1. E. F. Vasechkina, “Concept of informational technology of sustainable development support of mariculture in the nearshore zone of Crimea”, Environmental control systems, 2014, vol. 20, pp. 220-225.
2. E. F. Vasechkina, “Multi-element model of the pelagic plankton community”, Environmental control systems, 2013, vol. 19, pp. 247-252.
3. E. F. Vasechkina, “Simulation of an integrated multi-trophic aquaculture”, Proc. of Conf. MARESEDU - 2015, Moscow, MSU, October 2015, pp. 463-466.
4. E. F. Vasechkina, I. I. Kazankova, “Mathematical modeling of the growth and development of the mussel Mytilus galloprovincialis on artificial substrates”, Oceanology, 2014, vol. 54, № 6, pp. 763-770.
5. P. A. Lezin, “Peculiarities of aggregative behavior and spatial organization of mussels Mytilus edulis in the White Sea”, PhD thesis in biology, Institute of Zoology RAS, S.-Petersburg, 2009.
6. V. D. Brajko, “Dependence of mussels’ breathing on the size of respirometers”, Biologiya morya, 1979, vol. 48, pp. 15-21.
7. C. G. Paterson, “Effect of aggregation on the respiration rate of the freshwater unionid bivalve Elliptio complanata (Solander)”, Freshwat. Inv. Biol., 1983, № 2, pp. 139-146.
8. N. Yu, D. A. Culver, “Estimating the effective clearance rate and refiltration by zebra mussels, Dreissena polymorpha, in a stratified reservoir”, Freshwater Biology, 1999, vol. 41, pp. 481-492.
9. A. Zaiko, D. Daunys, “Density effects on the clearance rate of the zebra mussel Dreissena polymorpha: Flume study results”, Hydrobiologia, 2012, vol. 680, pp. 79-89.
10. N. C. Tuchman, R. L. Burks, C. A. Call, J. Smarrelli, “Flow rate and vertical position influence ingestion rates of colonial zebra mussels (Dreissena polymorpha)”, Freshwater Biology, 2004, vol. 49, pp.191-198.
11. A. B. Borovkov, R. G. Gevorgiz, “Productivity of Spirulina platensis and Tetraselmis viridis under various methods of cultivation”, Ecologiya morya, 2005, vol. 70, pp. 9-13.
12. J. Coughlan, “The estimation of filtering rate from the clearance of suspensions”, Mar. Bio., 1969, № 2, pp. 356-358.
13. V. I. Kholodov, A. V. Pirkova, L. V. Ladygina, “Functional characteristics of a typical mussel farm”, Rybnoye khozyajstvo Ukrainy, 2011, № 5, pp. 48-55.