


BISAC NAT010000 Ecology
BISAC NAT045050 Ecosystems & Habitats / Coastal Regions & Shorelines
BISAC NAT025000 Ecosystems & Habitats / Oceans & Seas
BISAC NAT045030 Ecosystems & Habitats / Polar Regions
BISAC SCI081000 Earth Sciences / Hydrology
BISAC SCI092000 Global Warming & Climate Change
BISAC SCI020000 Life Sciences / Ecology
BISAC SCI039000 Life Sciences / Marine Biology
BISAC SOC053000 Regional Studies
BISAC TEC060000 Marine & Naval
Modern technologies, which provide fast and accurate acquisition of high-resolution spatial data, have found widespread application in the monitoring of coastal processes. This paper reports the results of four years’ monitoring of a huge deflation/blowout/wind-scour basin dynamics at the Vistula Spit (southeast coast of the Baltic Sea). Information about the volume and size dynamics together with deflation/accumulation schemes and 3D elevation maps is presented. Basing on the obtained results, forecast of the deflation basin dynamics for 2016 was proposed. This paper implements the Terrestrial Laserscanning (TLS) method to the coastal processes investigation and demonstrates its high potential in this field.
Modern technologies, which provide fast and accurate acquisition of high-resolution spatial data, have found widespread application in the monitoring of coastal processes. This paper reports the results of four years’ monitoring of a huge deflation/blowout/wind-scour basin dynamics at the Vistula Spit (southeast coast of the Baltic Sea). Information about the volume and size dynamics together with deflation/accumulation schemes and 3D elevation maps is presented. Basing on the obtained results, forecast of the deflation basin dynamics for 2016 was proposed. This paper implements the Terrestrial Laserscanning (TLS) method to the coastal processes investigation and demonstrates its high potential in this field.
- Introduction
Terrestrial laserscanning (TLS) as technology of rapid spatial data acquisition has achieved widespread use in the coastal processes monitoring. Advantages of TLS allow remote and high-precision surveying of complex and/or inaccessible structures. The TLS data received on-site could be easily integrated and analyzed using geographic information systems (GIS) and computer-aided design (CAD) software.
TLS was used for the annual monitoring of fore-dune morphology in 2012-2015. The study site represents an element of a dune complex with rapidly developing deflation basin located in the northwestern part of the Vistula Spit (southeastern coast of the Baltic Sea, Fig.1). The Vistula spit itself represents an accumulative sand body with two-side sand supply formed during sea transgression and located south-west of Sambian Peninsula.
Displacement of marine deposits in the north-south direction is observed along the coast of the Vistula Spit. Until 1958, Sambian peninsula cliff abrasion represented the main sand supply to the Spit, which was later on replaced by the overburden from Kaliningrad Amber Combine tailings. Construction of two piers (North and South) near Baltiysk city has changed the lithodynamics in some parts of the Vistula Spit. Longshore deposits move bypass the piers, thus being displaced in the seaward direction, and then return to the coastline at fifth kilometer of the Vistula Spit length, after which the coast is characterized by relative stability [1, 2]. Annual mean coast erosion at 2.5 kilometers from the South pier is estimated to be 2.2 meters per year [2]. Study site is located 1.98 kilometers from South pier, which corresponds to the area of sand deposits deficiency and coastal erosion.
High-precision TLS monitoring was accomplished in order to evaluate the deflation magnitude in the blowout basing of mixed natural and anthropogenic origin.
.jpg)
- Materials and methods
Calculations was performed adapted from TLS data. TLS used early for the coastal processes investigation [3, 4, 5, 6]. Four TLS surveys were performed using two simultaneously operated topographic scanners Topcon GLS-1500 during the monitoring period 2012-2015. Surveys were carried out once in a year in the last week of June. Average point density was 64 points per square meter. Owing to the morphological changes occurred in the study area, the number of stations during each survey varied (24-27). Coordinate referencing was performed using satellite geodesic equipment: two Topcon GR-5 receivers were operated at the Real Time Kinematic (RTK) mode; corrections were received from the reference station in Kaliningrad.
Based on the obtained point clouds, triangular digital terrain models were created with ArcGIS software [reference]. According to these models, borders of the deflation basin were distinguished, and 3D models of dune complex were proposed. Raster digital terrain models with uniform grid (each cell contains information about the surface elevation) were built to estimate the elevation dynamics [7].
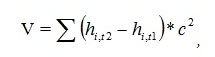
Annual volume change (V) in the basin was calculated as follows,
 (1)
(1)
where h represents cell elevation; t1 and t2 indices denote the elevation in the preceding year and in the year following the measurement; с represents length of the cell size.
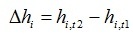
Magnitude of the elevation change (Δhi) was calculated (Eq.2) for each cell (i) in order to produce maps of relative deflation/accumulation.
 (2)
(2)
- Results and discussion
Meteorological situation during the monitoring period was characterized by the following values of annual mean wind speed and direction (Table 1), which were obtained from the automatic hydrometeorological station (AHMS) «Baltiysk».
Table 1. Annual mean wind speed and direction during the monitoring period.
|
Year |
Wind speed (m/s) |
Direction |
|
2012 |
4.2 |
240 о |
|
2013 |
3.8 |
270 о |
|
2014 |
3.3 |
195 о |
|
2015 |
5.1 |
240 о |
According to the high-water marks derived from the digital terrain models, deflation basin borders were defined and used to estimate the area of the basin and its dynamics (Fig.2).
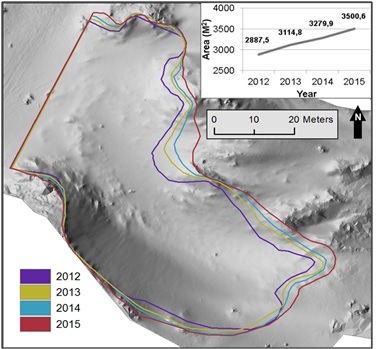
Figure 2. Deflation basin and its dynamics. Borders are depictured on the digital terrain model map of 2014.
Increase of the deflation basin was observed during the monitoring period. This expansion resulted from the reduction of residual foredune structures in the northern part of the basin and from the reduction of the sediment volume in the embryo dune field. Crowding of the borderlines indicates the relative stability of the corresponding sites, which is commonly associated with the presence of vegetation that traps the sand and stabilizes the surface against deflation. Basin axial size and the south border position have not changed much over the monitoring period. Basin area represents linear increasing trend with an average rate of 204 m2 per year.
The selected spatial dataset was constrained to the maximum deflation basin borderline observed in 2015 and then used to calculate annual elevation change (Eq.2) and produce the corresponding 3D maps (Fig.3).
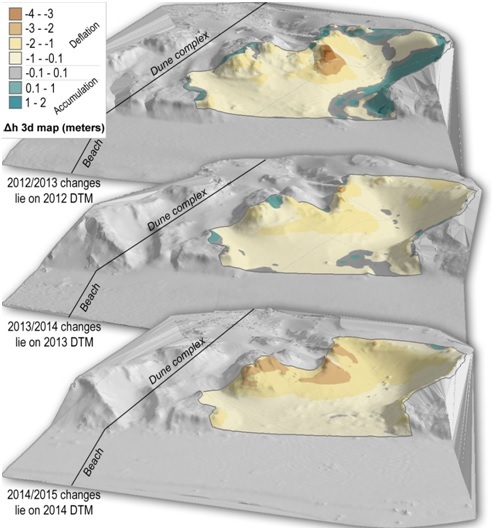
Figure 3. 3D maps of annual elevation change.
The rates of deflation and accumulation and their interannual variability were evaluated. Table 2 represents total volume of the deflation basin and the blowout volume rates.
Table 2. Total volume of the deflation basin and its dynamics
|
Year |
Volume of the basin (m3) |
Blowout volume rate (m3/year) |
|
|
7633 |
992 |
|
|
|
2013 |
8625 |
||
|
582 |
|||
|
2014 |
9208 |
||
|
573 |
|||
|
2015 |
9782 |
|
Deflation basin volume increased during the monitoring period with the maximum rate of 992 m3 per year observed in 2012-2013, which more than twice exceeded the rates in the subsequent years. This significant increase resulted from intense storm activity in autumn 2012. Strong south-west winds (up to 29 m/s) observed at the AHMS “Baltiysk” caused storm activity that affected the morphological structures. The blowout dynamics in the subsequent years was characterized by lower and relatively uniform rates.
According to the 3D maps of annual elevation change (Fig.3), there was a noticeable alternation of the deflation and accumulation processes over the monitoring period. In 2012-2013, the study site yielded noticeable areas of relative accumulation associated with gravitational processes at the south side of the basin, and eolian infill of several depressions and the eastern side of the basin, which caused flattening of the slope. At the same time, areas with intense deflation, which was apparently caused by the storm events, were present. In the following years, the number of accumulation zones decreased and were gradually replaced by the intensified deflation. Quantitative evaluation of these processes is possible through the calculation of deflation/accumulation volume per unit area (Table 4).
Table 3. Quantitative estimation of the processes in the deflation basin
|
|
2012/2013 |
2013/2014 |
2014/2015 |
Average |
|
Deflation, m3/m2 |
0.69 |
0.65 |
1.02 |
0,77 |
|
Accumulation, m3/m2 |
0.38 |
0.09 |
0.14 |
0,21 |
|
Balance, m3/m2 |
-0.31 |
-0.56 |
-0.88 |
-0.56 |
|
Active volume, m3/m2 |
1.08 |
0.74 |
1.16 |
0.99 |
Obtained results showed heterogeneity of the present-day dynamics of the deflation basin. Overall balance between the processes is negative during the whole period, indicating the prevalence and intensification of deflation processes over the decreasing rates of accumulation. Relatively high accumulation in 2012-2013 has subsequently decreased as a result of migration in the south-west direction.
Considering the dynamics of the basin area and the accumulation/deflation rates, a forecast of the deflation basin state for 2016 was proposed. Figure 4 represents the results of the prediction.
.jpg)
Figure 4. 3D map of the predicted elevation for the 2016.
Natural neighbor method was implemented to model the 3D elevation map. Predicted values of elevation change indicate possible flattening of the basin sides and overall increase of its size with the basin volume expansion of about 730 m3 per year on the assumption of absence of strong storm events. Continuing deflation of the residual structures at the northern side and sand transport in south-west direction out from the basin is projected. Furthermore, neighboring structures are expected to be gradually drawn in the deflation process.
Overall condition of the basin, significant rate of deflation and its intensifying dynamics demand recovery measures. Consolidation of the residual structures, which are subject to significant destruction at the northern side of the basin, is necessary. It is strongly recommended to eliminate the access of motor transport and limit the walk-in accessibility to the site.
- Acknowledgment
The work was partly financed by the Russian Scientific Fund (grant 14-37-00047).
1. Jyndarev L.A., 2009. Technogenic accumulative relief forms on a Southeastern baltic coast. The creation and use of artificial land on the banks of reservoirs and water areas: Proceedings of International Conference. Novosibirsk, pp. 187-196
2. Bobykina V.P., Karmanov K.V., 2009 - Coastal dynamics of the Gdansk lagoon and relations with anthropogenic influence. Proceedings of International Conference. Novosibirsk, pp. 119-124
3. Brizi E., Brunetti A., Martino S., Margottini C., Mazzanti P., Mugnozza G. S. 2015. Terrestrial Laser Scanning survey of the Sugano cliff (Orvieto, Italy) for slope stability analyses. Rend. Online. Soc. Geol. It., Vol 35(2015), pp. 38-41.
4. Montreuil A.-L., Bullard J., Chandler J. H, Millett J. 2003. Decadal and seasonal development of embryo dunes on an accreting macrotidal beach: North Lincolnshire, UK. Earth Surface Processes and Landforms 38(15).
5. Dudzinska-Nowak J, Furmanczyk K. 2009. A laser scanning applications for volumetric changes of the beach and dunes analyses. 2nd International Conference on Climate Change -The environmental and socio-economic response in the southern Baltic region, Szczecin.
6. Danchenkov A.R., Belov N.S., 2015. Volumetric estimation of the storm impact on dunes complexes of the Curonian Spit, Baltic Sea. Geology of seas and oceans: Proceedings of XXI International Conference on Marine Geology. Vol. IV.: Moscow
7. Li, Z., Zhu, Q. Gold, C., 2005, Digital Terrain Modelling: Principles and Methodology, CRC Press.