


с 25.12.2016 по настоящее время
BISAC NAT010000 Ecology
BISAC NAT045050 Ecosystems & Habitats / Coastal Regions & Shorelines
BISAC NAT025000 Ecosystems & Habitats / Oceans & Seas
BISAC NAT045030 Ecosystems & Habitats / Polar Regions
BISAC SCI081000 Earth Sciences / Hydrology
BISAC SCI092000 Global Warming & Climate Change
BISAC SCI020000 Life Sciences / Ecology
BISAC SCI039000 Life Sciences / Marine Biology
BISAC SOC053000 Regional Studies
BISAC TEC060000 Marine & Naval
During spring and summer (2014) environmental investigations of the sea coastal zone, conducted in the frameworks of the Baltberegozaschita (Kaliningrad) program, determinations of content of heavy metals and oil products in the bottom sediments along the shore of the northern coast of the Kaliningrad Region were performed. The highest values of their contents were found in the middle part of the Curonian Spit (near the border with Lithuania). According to Swedish classification WGMS 2003-SSQC these values correspond to the highest 4 and 5 Classes of Contamination. At the Curonian Spit, which is a protected area, unknown any significant sources of anthropogenic pollution. Supposedly, the origin of the detected anomaly is connected with influence of along shore bed load, directed from abrasive coast of the Sambia Peninsula along the Curonian Spit, to its middle part, where accumulation of sedimentary material is dominated. The shore of the Sambia Peninsula is much more populated and used for recreational purposes, and can therefore be considered as a possible source of contamination.
Southeastern Baltic Sea, alongshore suspended sediment transport, seabed sediments contamination by heavy metals and oil products
I. Introduction
Coastal zones are characterised by intensive urbanization [1]. Consequently, they suffer from considerable anthropogenic impact. In addition, coastal waters due to active hydrodynamic factors are the most dynamic in comparison to other parts of the sea basin. Here, sedimentation in occurs more rapidly as a result of numerous processes: winds and waves as well as local atmospheric circulation patterns [3, 4].
As a result of the active circulation, an intense mechanical separation of polydisperse solid particles occurs [5] together with redistribution of contamination, which depends on the sorption capacity of the sediment and the size of the particles.
The present research is particularly relevant taking into account the fact that the Curonian Spit is a unique nature site, which is on the UNESCO World Heritage list.
II. Materials and methods
Samples from the underwater coastal slope and beaches of the northern coast of the
In order to determine the content of heavy metals (Cd, Cu, Pb, and Hg) and oil products (OP) in coarse sediments, the data of environmental monitoring during oil extraction at the "Kravtsovskoye” (D-6) platform were used. The data obtained from the engineering and environmental surveys, and exploratory drilling in the promising oil-bearing structures (158 values in total) were also used (see. Fig. 1).
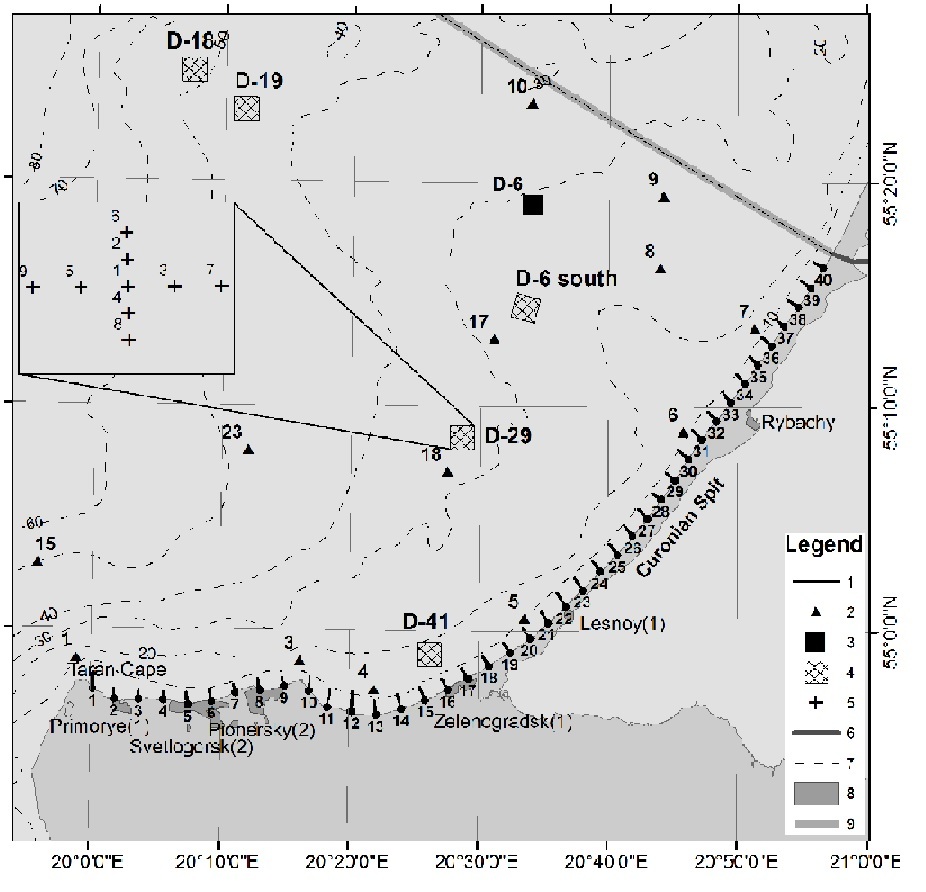
Figure 1. Area of investigations. Legend: 1 – Sampling profiles in 2014; 2 - Background points; 3 - The sea ice-resistant fixed platform D-6; 4 – Sites of engineering and environmental surveys, environmental monitoring during exploratory drilling in the oil-bearing structures; 5 - Sediment sampling points in the oil-bearing structures (background); 6 - The state border with Lithuania; 7 - Isobaths, m; 8 - Coastal settlements (in parentheses - the number of samples taken in the residential areas); 9 - Exclusive Economic Zone (EEZ).
The physical property analysis - the particle size analysis - was done by sieve tests, using the Krumbein phi scale [7]; the mesh sizes of the sieve were 4.0; 2.8; 2.0; 1.4; 1.0; 0.71; 0.5; 0.355; 0.25; 0.18; 0.125; 0.09; and
The chemical analysis of soils and sediment samples was carried in the "Centre of laboratory analysis and technical measurements of the
The Swedish classification WGMS 2003-SSQC was used to assess sediment contamination [8]. The general direction of the alongshore sediment transport was determined according to [9]. It helped to identify the prevailing vectors of sediment contamination. Calculation of the alongshore sediment-driving force was performed for the period of October-March of 2013-2014. The data on the wind speed and wind direction were obtained from Automatic Hydro-Meteorological Station Minikrams-4, located on the off-shore D-6 oil platform at a height of
The particle size analysis [11] was used to confirm direction of the last significant bed load in the linear sector of the underwater coastal slope of the Curonian Spit (profiles 19-40).
III. results
Seabed sediment
Seabed sediments in the studied area were mainly composed of sands of different grain size having a median diameter of 0.26 ±
Toxic substances were found in almost all industrial discharges and household runoffs [12], the main source of contamination being seaside settlements, rivers and transboundary transport [13]. The average concentration of heavy metals was usually higher than the background level of contamination (Table 1).
The
The Cu distribution pattern is of particular concern. The Cu concentration corresponding to Contamination Class 5 was registered near the Rybachy settlement (profiles 28, 32, 34, 35, 38 and 40 having 240, 170, 340, 150, 160, 240 mg/kg, respectively). It should be noted that during the 2013-2014 environmental monitoring of “Kravtsovskoye” D-6 oil platform, the Cu concentration corresponded to Contamination Class 4 and 5 (in 2013–110 mg/kg and 200 mg/kg; in 2014 - 110 mg/kg and 300 mg/kg in the background points 7 and 6, respectively).
The Ni and Pb content matched Contamination Class
Table 1. The average content of heavy metals in the seabed sediments compared to their background values
|
Heavy metal |
The content of toxic metals in the coastal zone (2014) |
Contamination class according to [8] |
Background value |
ơ |
Contamination class according to [8] |
|||
|
Min |
Max |
Average |
ơ |
|||||
|
mg/kg |
||||||||
|
Cd |
˂0.05 |
0.96 |
0.42 |
0.25 |
2 |
0.36 |
0.63 |
2 |
|
Cu |
0.98 |
340 |
67.8 |
74.6 |
4 |
10.3 |
31.4 |
1 |
|
Ni |
<0.5 |
120 |
7.1 |
19.2 |
1 |
- |
- |
- |
|
Pb |
<0.5 |
130 |
5.4 |
21.0 |
1 |
1.64 |
2.35 |
1 |
|
Zn |
4 |
230 |
13.7 |
13.5 |
1 |
- |
- |
- |
|
Hg |
<0.005 |
0.01 |
0.005 |
0.002 |
1 |
0.005 |
0.007 |
1 |
Table 2. The ratio of pollutants in the seabed sediments of the
|
Pollutant |
The |
The Curonian Spit (profiles 18-40) |
||||||
|
Min |
Max |
Average |
ơ |
Min |
Max |
Average |
ơ |
|
|
mg/kg |
mg/kg |
|||||||
|
Hg |
<0.005 |
0.007 |
˂0.005 |
- |
<0.005 |
0.01 |
0.005 |
0.002 |
|
Cd |
˂0.05 |
0.96 |
0.46 |
0.26 |
˂0.05 |
0.86 |
0.40 |
0.23 |
|
Cu |
0.98 |
56 |
25.3 |
18.6 |
20 |
340 |
98.7 |
84.7 |
|
Ni |
0.67 |
12 |
5.41 |
4.02 |
<0.5 |
120 |
8.41 |
25.24 |
|
Pb |
<0.5 |
19 |
1.71 |
4.64 |
<0.5 |
130 |
8.03 |
27.34 |
|
Zn |
5.7 |
24 |
14.7 |
4.6 |
4 |
230 |
26.1 |
48.7 |
|
OP |
˂40 |
120 |
52.6 |
36.3 |
˂40 |
1380 |
151.8 |
305.4 |
Coastal research
The average content of pollutants on the beaches (Table 3) is multiply lower than that of the underwater coastal slope. The exception was Zn, the concentration of which was comparable to that in the seabed sediments. The most polluted beaches were those of the
Table 3 - The content of pollutants in the beach sediment
|
Pollutant |
The minimum concentration |
Maximun concentration |
The average concentration |
ơ |
|
mg/kg |
||||
|
Cd |
0.06 |
0.54 |
0.2 |
0.12 |
|
Cu |
<0.5 |
85 |
14.47 |
19.32 |
|
Ni |
<0.5 |
4.8 |
1.76 |
1.26 |
|
Pb |
<0.5 |
5.8 |
0.96 |
1.06 |
|
Zn |
1.4 |
190 |
11.31 |
30.21 |
|
Hg |
<0.005 |
0.008 |
<0.005 |
- |
|
OP |
˂40 |
72 |
˂40 |
- |
Table 4. Pollution of the
|
Pollutant |
The |
The Curonian Spit |
||||||
|
Min |
Max |
Average |
ơ |
Min |
Max |
Average |
ơ |
|
|
mg/kg |
mg/kg |
|||||||
|
Hg |
<0.005 |
<0.005 |
˂0.005 |
- |
<0.005 |
0.008 |
˂0.005 |
- |
|
Cd |
0.08 |
0.54 |
0.24 |
0.14 |
0.061 |
0.39 |
0.16 |
0.08 |
|
Cu |
0.88 |
89 |
21.2 |
24.4 |
<0.5 |
45 |
9.0 |
11.9 |
|
Ni |
0.86 |
4.2 |
1.83 |
0.72 |
<0.5 |
4,8 |
1.7 |
1.6 |
|
Pb |
<0.5 |
3.5 |
0.95 |
0.84 |
<0.5 |
5,8 |
0.96 |
1.24 |
|
Zn |
2.1 |
190 |
19.8 |
44.2 |
1.4 |
8.1 |
4.4 |
2.0 |
|
OP |
˂40 |
72 |
˂40 |
- |
˂40 |
50 |
˂40 |
- |
As it was expected, the average content of pollutants in the settlements of the Sambia Peninsula was much higher than on the beaches: Cd - 0.53 ± 0.19 mg/kg; Cu - 28.43 ± 7.76 mg/kg; Ni - 2,63 ± 2.03 mg/kg; Pb - 5.36 ± 4.44 mg/kg; Zn - 28.43 ± 28.86; Hg - 0.28 ± 0.51 mg/kg; OP - 181.29 ± 157.76 mg/kg.
The study identified potential contamination sources (settlements on the northern coast of the
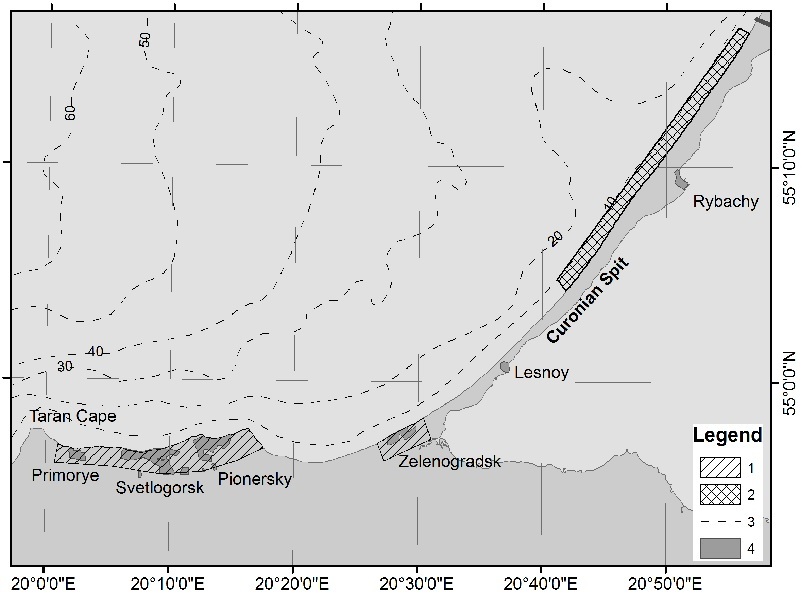
Fig. 2. Areas of potential contamination and accumulation of pollutants.
Legend: 1 – Pollutants input areas; 2 – Areas of massive contamination (Contamination Class 4-5 for Zn, Ni, Pb, Cu calculated according to WGMS 2003-SSQC [8] and oil products multiply exceeding the background values); 3 - Isobaths, m; 4 - Coastal settlements.
IV. Discussion
On the Curonian Spit, a protected nature reserve, there are no sources of anthropogenic pollution. Presumably, the reason for the identified deviations from the norm is the impact of the alongshore suspended sediment transport. Many authors [14-26] confirmed the presence of the alongshore transport of suspended sediment. It is important to note that the recent works [25-26] have been carried out using the meteorological data of the second half of the XX century. Given climate change [27-31], meteorologists have observed changes in wind and wave patterns, which in their turn, lead to changes in the characteristics of the alongshore transport of sediment.
Storms play a dominant role in the transport of sediment [26]. The autumn-winter season in the Southeastern Baltic is characterized by the highest frequency of gale-force winds [32], resulting in active lithodynamic processes.
Contemporary calculations done for the previous period of storms helped to identify the general direction of the alongshore bed load (Table 5). The positive sign of the relative sediment-driving force (τ) (see. Table 5) indicates a unidirectional general transport of the sediment from the
Table 5. Results of calculation of the sediment-driving force components T1 and T2, sediment transport scale A; resultant sediment-driving force T; breaking waves force B, energy vectors values of the general sediment-driving activity E; relative sediment-driving force τ (conditional kilo-units)
|
Profile |
T1 |
T2 |
A |
T |
B |
E |
τ |
|
1 |
51.9 |
-7.5 |
59.4 |
44.3 |
53.8 |
69.7 |
0.82 |
|
3 |
28.4 |
-5.1. |
33.6. |
23.3 |
30.1 |
38.1 |
0.77 |
|
5 |
29.7 |
-6.6. |
36.3 |
23.1 |
37.6 |
44.1 |
0.61 |
|
7 |
31.2 |
-4.9 |
36.1. |
26.3 |
37.4 |
45.7 |
0.70 |
|
9 |
27.4 |
-7.7 |
35.1. |
19.7 |
40.0 |
44.6 |
0.49 |
|
11 |
30.7 |
-12.0 |
42.7 |
18.7. |
43.9 |
47.7 |
0.43 |
|
13 |
41.4 |
-8.8 |
50.2 |
32.6. |
51.2 |
60.7 |
0.64 |
|
15 |
14.3 |
-9.9 |
24.1 |
4.4 |
21.0 |
21.5 |
0.21 |
|
17 |
32.5 |
-5.0 |
37.5 |
27.6 |
34.7 |
44.3 |
0.79 |
|
19 |
33.9 |
-7.1 |
41.0 |
26.7 |
44.9 |
52.3 |
0.60 |
|
21 |
36.4 |
-9.0 |
45.4 |
27.4 |
52.4 |
59.1 |
0.52 |
|
23 |
45.9 |
-12.6 |
58.5 |
33.3 |
64.8 |
72.9 |
0.51 |
|
25 |
79.9 |
-12.1 |
92.0 |
67.8 |
88.3 |
111.4 |
0.77 |
|
27 |
76.9 |
-14.1 |
91.0 |
62.8 |
93.1 |
112.3 |
0.68 |
|
29 |
80.4 |
-14.2 |
94.6 |
66.3 |
95.5 |
116.3 |
0.69 |
|
31 |
75.7 |
-24.0 |
99.8 |
51.7 |
106.6 |
118.5 |
0.48 |
|
33 |
79.3 |
-24.0 |
103.3 |
55.3 |
108.9 |
122.1 |
0.51 |
|
35 |
85.0 |
-24.0 |
109.0 |
61.0 |
113.5 |
128.8 |
0.54 |
|
37 |
84.8 |
-23.9 |
108.7 |
60.8 |
113.2 |
128.5 |
0.54 |
|
39 |
88.1 |
-23.9 |
112.0 |
64.2. |
115.5 |
132.2 |
0.56 |
Within the area with shallow water and jagged coastline, there are no prerequisites for an extended unidirectional alongshore drift of loose sediment [33]. It should be noted that sediment transport scale A (see Table 5) reaches its maximum values near the middle part of the Curonian Spit, which leads to an increased probability of multidirectional drifts of sediment.
Calculation of the granulometric characteristics (reflecting the direction of the last sediment transport), allowed to identify the most probable vector of sediment transport and, consequently, contamination spots (Table 6). The results of the calculation do not contradict the ones obtained by other authors [25, 34] and confirm the general vector of transport of sediment material from the
Table 6. Probability of the direction of the last significant sediment transport
|
Sediment transport direction |
The number of pairs that meet the specified conditions |
Z |
Significance level |
|||
|
Case 1 |
Case 2 |
Case 1 |
Case 2 |
Case 1 |
Case 2 |
|
|
19 → 40 North-East |
69 |
11 |
7.98 |
-3.56 |
0.01 |
- |
|
40 → 19 South-West |
4 |
26 |
-4.95 |
-0.57 |
- |
- |
Concentration of pollutants in the sediments near the Rybachy settlement indicates the weakening of the alongshore transport at the analysed site, and the formation of a sediment accumulation zone.
V. Conclusions
Deviations from the norm in the content of heavy metals and oil products along the underwater coastal slope of the Curonian Spit are caused by the redistribution of solid sediment as a result of coastal lithodynamic processes. The prevailing direction of sediment transport is from the northern coast of the
The beaches of the northern coast of the
VI. Acknowledgment
The work was performed within the Federal Task Programme of the Ministry of Education and Science of Russia “Investigations and elaborations on priority tendencies of scientific-technological complex development in
1. R.D. Kos'yan and N.V. Pyhov, Hydrogenous sediment transport in the coastal zone of the sea, Moscow: Nauka, 1991, 280 p.
2. Saf'yanov G.A., Coastal ocean zone in the XX century, Moscow: Mysl', 1978, 263 p.
3. Yu.S. Dolotov, Dynamic conditions for coastal marine relief formation and sedimentation, Moscow: Nauka, 1989, 269 p.
4. N.A. Aybulatov, The dynamics of solids in the offshore zone, Leningrad: Hydrometeoizdat, 1990, 271 p.
5. E.M. Emel'yanov "The distribution of chemical elements and components in the sediment and some features of their diagenesis", Sedimentation in the Gdansk Basin (The Baltic Sea). Ad. E.M. Emel'yanov, Moscow, AS USSR. 1987. pp. 217-242.
6. V.T. Trofimov and D.G. Ziling, Environmental geology, Moscow Geoinformmark, 2002, 415 p.
7. W.C. Krumbein, "Size frequency distributions of sediments", Journal of Sedimentary Petrology, 1934, vol. 4, pp. 65-77.
8. WGMS 2003, "Report of the Working Group on Marine Sediments in Relation to Pollution", ICES CM 2003 / E:04.
9. R.Ya. Knaps, "On the method of determining the movement characteristics of the sediment in non tidal seas", Scientific Reports of the Institute of Geol. and Geogr. AS LitSSR. Geofisics, 1956. vol. 3. Vilnus, pp. 141-143.
10. "Manual to Meteorological Instruments and Methods of Observations", 5th ed., Secretariat of the World Meteorological Organization, Geneva- Switzerland, 1983. N 8, 1988, Obninsk: VNIIGMI-MCD.
11. P. MacLaren and D. Bowles, "The effects of sediment transport on grain-size distributions", Journal of Sedimentary Petrology, 1985, vol. 55, N 4, pp. 0457-0470.
12. E.M. Emel'yanov, V.A. Kravtsov, V.V. Sivkov, and E.V. Dorokhova, "Toxic substances in the bottom sediments", In: Oil and environment of the Kaliningrad Region, vol. 2: TheSea, Ad. by V.V. Sivkov, Kaliningrad: Terra Baltica, 2012, pp. 304-314.
13. O.V. Bass, "Introducing of oil products from the coast", In: Oil and environment of the Kaliningrad Region, vol. 2: The Sea, Ad. by V.V. Sivkov, Kaliningrad: Terra Baltica, 2012, pp. 174-181.
14. N.A. Bogdanov, V.A. Sovershaev, L.A. Zhindarev, A.P. Agapov, "The evolution of ideas about the dynamics of the south-eastern shores of the Baltic Sea", Geomorphology, 1989, N 2. pp. 62-69.
15. O.K. Leont'yev, L.A. Zhindarev, O.I. Ryabkova, "The origin and evolution of large coastal accumulative forms", Theoretical problems of development of the sea coasts, AS USSR. Moscow: Nauka, 1989, pp. 83-91.
16. Yu. D. Shujsky, "Features of coastal marine placers of Eastern Baltic in connection with the regime of the alongshore bed load", Diss. cand. geogr. sciences, in 2 vol., Moscow, IO AS USSR, 1969, 292 p.
17. Yu. D. Shujsky, V.L. Boldyrev, B.V. Kochetkov, "On the conditions and characteristics of the formation of of coastal marine placers of the eastern part of the Baltic Sea", DAS USSR, vol. 194, N 1, 1970. pp. 187-190.
18. O.I. Ryabkova, "The dynamics of the coast of the Sambia Peninsula and the Curonian Spit in connection with the problems of coastal protection", Abstr. of diss. cand. geogr. sc. Moscow: Geogr. dep. MSU, 1987, 17 p.
19. R.Ya. Knaps, "Protecting structures such as moles and the movement of sediment on sandy coasts", Proc. of AS Latv SSR, 1952, N 6 (59), pp. 87-130.
20. V.P. Zenkovich, "Some aspects of the dynamics of the Polish coast of the Baltic Sea", Proc. VGO, vol. 90, issue 3. Moscow, 1958.
21. V.L. Boldyrev and V.P. Zenkovich, "The Baltic Sea", The Far East and the shores of seas washing the territory of the USSR. Moscow: Nauka, 1982, pp. 214-218.
22. V.L. Boldyrev, V.K. Gudelis, and R.Ya. Knaps, "Currents of sand deposits in the Southeastern Baltic", Studies of the dynamics of sea coasts relief, Moscow: Nauka, 1979, pp. 14-18.
23. V.G. Ul'st, "Differentiation of sandy material in accordance with form of grains in the coastal marine environment", Baltica, vol. 2, Vilnius, 1965, pp. 167-180.
24. V.I. Kirlis, "Some features of the dynamics of coasts of Kursiu Nerija", Proc. AS LitSSR, 1971, is. B. vol. 4 (67), pp. 211-224.
25. A.N. Babakov, "Spatial and temporal structure of migration flows and sediment in the coastal zone of Southeastern Baltic (the Sambia Peninsula and the Curonian Spit)", Diss. cand. geogr. sc. Kaliningrad: KSU, 2003, 273 p.
26. A.N. Babakov, "The dynamics of sediments in the coastal sea area", In: Oil and environment of the Kaliningrad Region, vol. 2: The Sea, Ad. by V.V. Sivkov, Kaliningrad: Terra Baltica, 2012, pp. 37-59.
27. BACC Author Group., Assessment of climate change for the Baltic Sea basin, Berlin: Springer-Verlag, 2008, 473 p.
28. IPCC Fourth Assessment Report: Climate Change, 2008.
29. IPCC, 2013: Climate Change 2013: The Physical Science Basis. Contribution of Working Group I to the Fifth Assessment Report of the Intergovernmental Panel on Climate Change [Stocker, T.F., D. Qin, G.-K. Plattner, M. Tignor, S.K. Allen, J. Boschung, A. Nauels, Y. Xia, V. Bex and P.M. Midgley (eds.)]. Cambridge University Press, Cambridge, United Kingdom and New York, NY, USA, 1535 p.
30. HELCOM, "Climate change in the Baltic Sea Area: HELCOM thematic assessment in 2013", Baltic Sea Environment Proceedings, 2013, N 137. 66 p.
31. N. Rangel-Buitrago, "Winter wave climate, storms and regional cycles: the SW Spanish Atlantic coast", International Journal of Climatology, 08/2013; 33:2142-2156. DOI:https://doi.org/10.1002/joc.3579.
32. V.F. Dubravin and Zh. I. Stont, "Hydrometeorological regime, structure and circulation of waters", In: Oil and environment of the Kaliningrad Region, vol. 2: The Sea, Ad. by V.V. Sivkov, Kaliningrad: Terra Baltica, 2012, pp. 69-105.
33. E.M. Emel'yanov, The barrier zone in the ocean. Sediment- and ore formation, geoecology, Kaliningrad: Yantarny skaz, 1998, 416 с.
34. A.Yu. Sergeev, "Features of the direction of sand material transport in the coastal zone of Sambia Peninsula of the Kaliningrad Region", Proc. of XVIII Intern. scient. conf. (school) in mar. geol., Moscow, GEOS, 2009, vol.5, pp. 145-150.
35. E.M. Emel'yanov, A.I. Blazhchishin, O.I. Koblenc-Mishke, V.A. Kravtsov, D.K. Stryuk, and G.S. Kharin, "Ecological and geochemical conditions in the Eastern Baltic", Problems in the Study and nature conservation of the Curonian Spit, eds. by V.M. Slobodyanik and A.R. Manukyan, Kaliningrad: GP KST, 1998, pp. 148-185.