


с 25.12.2017 по настоящее время
с 25.11.2017 по настоящее время
Геофизический центр Российской академии наук
Майкопский государственный технологический университет
Московский университет имени С. Ю. Витте
Россия
BISAC NAT010000 Ecology
BISAC NAT045050 Ecosystems & Habitats / Coastal Regions & Shorelines
BISAC NAT025000 Ecosystems & Habitats / Oceans & Seas
BISAC NAT045030 Ecosystems & Habitats / Polar Regions
BISAC SCI081000 Earth Sciences / Hydrology
BISAC SCI092000 Global Warming & Climate Change
BISAC SCI020000 Life Sciences / Ecology
BISAC SCI039000 Life Sciences / Marine Biology
BISAC SOC053000 Regional Studies
BISAC TEC060000 Marine & Naval
Ships, seeps from the seabed, municipal and industrial waste waters, and the atmosphere are the main sources of sea water contamination with oil and oil products. During the satellite monitoring of the Kravtsovskoe oilfield (D-6) (2004-2015) the area west of Sambia Peninsula and anchorage in front of entrance to Kaliningrad Sea Canal were localized as the most polluted area of the Southeastern Baltic Sea. Oil spill drift forecast from these areas with a help of Seatrack Web model (SMHI, HELCOM) has shown that the average annual direction of oil pollution drift is directed to the North-East. In some cases, leakage of oil or oil products from ships west of Sambia Peninsula could be a reason of oil contamination of beaches of the “Curonian Spit” National Park.
Southeastern Baltic Sea, oil pollution, satellite imagery, oil spill drift forecast, Seatrack Web model
I. Introduction
The Baltic Sea is one of the busiest waterways in the
The main sources of oil pollution in the sea are natural hydrocarbon seeps, rivers, waste waters, shipping and atmosphere [2-9]. In the
Oil production on the shelf of the
II. Data
Data on oil pollution of the
In total 1946 radar images were analyzed, and 1232 oil spills were detected during the analysis of satellite radar images (Fig. 1). “Tail”-shaped oil spills are prevailed, what means that these spills are originated from moving ships [11].
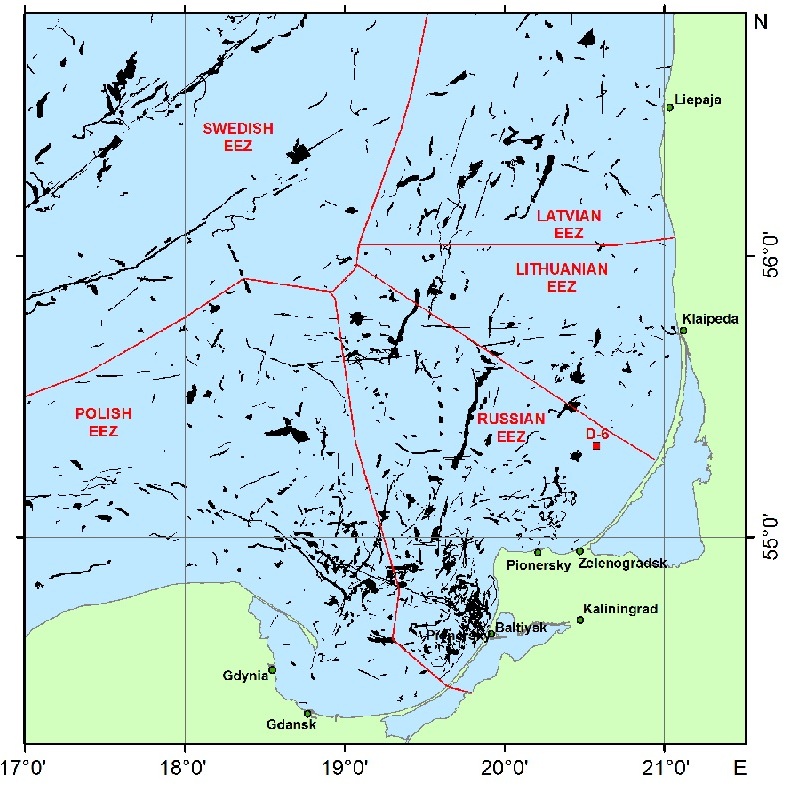
Fig. 1. Distribution of oil spills on the sea surface in the
detected by satellite observations from June 2004 to December 2015.
III. Numerical modelling
The Seatrack Web numerical model was used for prediction of drift and transformation of oil pollution. Seatrack Web is the HELCOM operational oil spill drift forecasting system which is based on operational weather and hydrodynamics forecasts. Oil spill drift model calculates the drift and spreading of oil spills using a Lagrangian particle tracking technique. Weathering processes such as evaporation, vertical dispersion and formation of water-in-oil emulsions are also calculated based on the standard formulae.
The system uses two different operational weather models ECMWF and HIRLAM (HIgh Resolution Limited Area Model,
Two modeling areas were selected west of
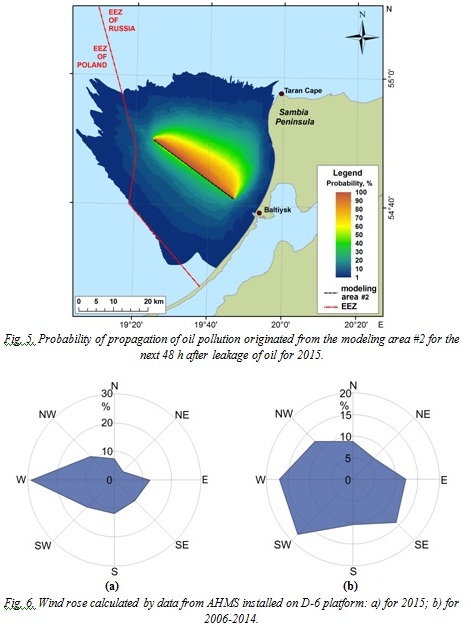
Forecasts of potential oil spills drift originated from modeling areas #1 and #2 were calculated for every day of 2015 for 48 hours. 365 daily forecasts for both regions were combined in the probability maps of oil contamination of the sea surface during 48 hours after appearance of an oil slick (Fig. 4, 5). These maps show that during the first 48 h after a release of oil from ships, in most cases, oil pollution will drift to the North-East, what corresponds to the general wind direction in this region as registered at Autonomous Hydro Meteorological Station (AHMS) installed on D-6 platform (Fig. 6). The main direction of the contamination propagation is also in agreement with local currents and the direction of mean annual transport of substances in the
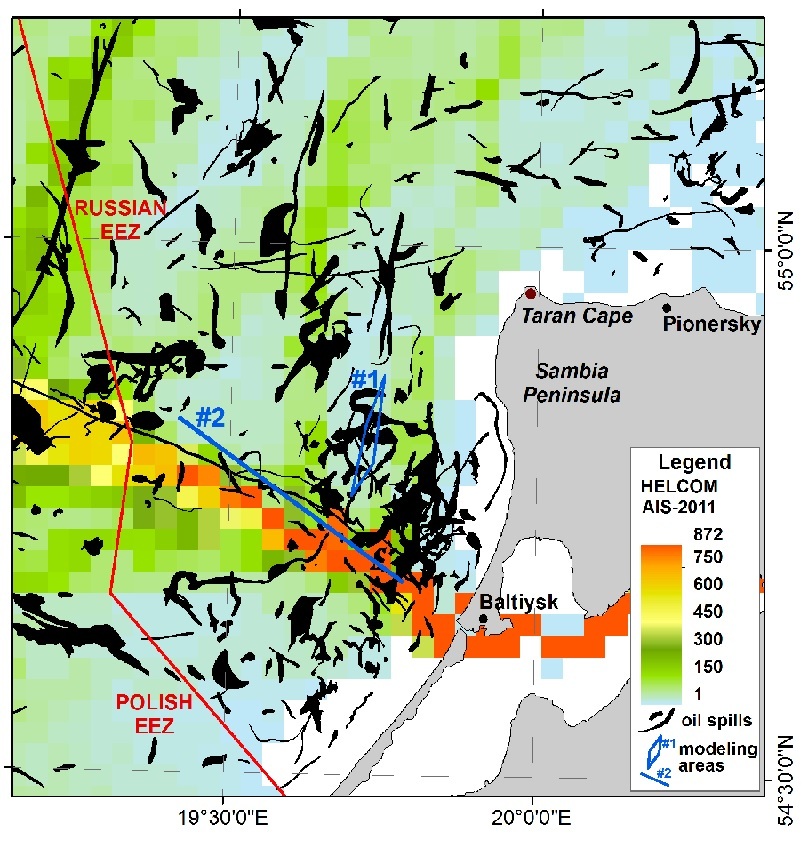
Fig. 2. Location of modeling areas #1 and #2 (blue lines) west of

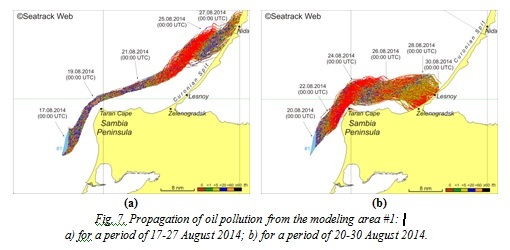
In particular cases, oil pollution appearing from the modeling area #1 during 11 days after leakage may reach Curonian Spit beach (Fig. 7). Thus, at specific meteo and hydrological conditions for periods of 17-27 August and 20-30 August 2014 the oil spill could reach the Curonian Spit shore near Nida (Fig. 7a), or the area from Zelenogradsk to Lesnoy (Fig. 7b). These examples show that oil released west of
As discussed in [19], the observed oil spills are shifted from the shipping route (area #2) northeastward (see Fig. 2). The results of numerical simulation of potential oil pollution from the shipping route leading to the
IV. Conclusions
Numerical simulations using Seatrack Web model for two areas of appearance of oil spills west of
V. Acknowledgment
A.V. Krek performed the modeling of potential oil pollution using Seatrack Web model in the framework and with a support of the Russian Science Foundation Project N 14-37-00047. E.V. Bulycheva and A.G. Kostianoy conducted a study of oil pollution using satellite data in the framework and with a support of the Russian Science Foundation Project N 14-50-00095. Satellite radar data were provided by LUKOIL-KMN, Ltd.
1. http://www.helcom.fi/helcom-at-work/groups/maritime
2. http://www.helcom.fi/action-areas/shipping
3. I. A. Nemirovskaya. Ocean Hydrocarbons: Snow, Ice, Water, Suspended Matter, and Bottom Sediments (Nauchnyi Mir, Moscow, 2004) (in Russian).
4. I. A. Nemirovskaya, “Oil hydrocarbons”, in Oil and Environment of Kaliningrad Oblast, Vol. 2: The Sea, Ed. by V. V. Sivkov (Terra Baltika, Kaliningrad, 2012), pp. 152-173 (in Russian).
5. I. A. Nemirovskaya. Oil in an Ocean: Pollution and Natural Flows (Nauchnyi Mir, Moscow, 2013) (in Russian).
6. S. A. Patin. Oil and Ecology of the Continental Shelf (VNIRO, Moscow, 2001) (in Russian).
7. S. A. Patin. Oil Spills and Their Impact on Marine Environment and Biological Resources (VNIRO, Moscow, 2008) (in Russian).
8. J. Burger, Oil Spills (Rutgers University Press, New Brunswick, 1997).
9. A. G. Kostianoy and O. Yu. Lavrova (Eds.). Oil Pollution in the Baltic Sea (Springer-Verlag, New York, 2014), Vol. 27.
10. A. Nelson-Smith. Oil Pollution and Marine Ecology, (Paul Elek, London, 1972).
11. E.V. Bulycheva, A.G. Kostianoy, A.V. Krek. Interannual variability of the sea surface oil pollution in the Southeastern Baltic Sea in 2004-2015. Modern problems of remote sensing of the Earth from space, Vol. 13, N 3, 2016 (in press, in Russian).
12. E.V. Bulycheva, A.G. Kostianoy. Results of the satellite monitoring of oil pollution in the Southeastern Baltic Sea in 2006-2009. Modern problems of remote sensing of the Earth from space, Vol. 8, N 2, 2011, P. 74-83 (in Russian).
13. A.G. Kostianoy, O.Yu. Lavrova (Eds.). Oil pollution in the Baltic Sea. Springer-Verlag, Berlin, Heidelberg, New York. Vol. 27, 2014, 268 pp.
14. A.G. Kostianoy, E.V. Bulycheva. Numerical simulation of risks of oil pollution in the Southeastern Baltic Sea and in the Gulf of Finland. Modern problems in remote sensing of the Earth from space, Vol. 11, N 4, 2014, P. 56-75 (in Russian).
15. E.V. Bulycheva, A.V. Krek, A.G. Kostianoy, A.V. Semenov, A. Joksimovich. Oil pollution in the Southeastern Baltic Sea by satellite remote sensing data in 2004-2015. Transport and Telecommunication, 2016, V.17, N2, P. 155-163.
16. 1Meier, H.E.M. (2007) Modelling the pathways and ages of inflowing salt- and freshwater in the Baltic Sea. Estuarine, Coastal and Shelf Science, N74, 610-627.
17. E.V. Bulycheva, A.V. Krek, A.G. Kostianoy, A.V. Semenov, A. Joksimovich. Oil Pollution Of The Southeastern Baltic Sea By Satellite Remote Sensing Data And In-Situ Measurements - Transport and Telecommunication, 2015, V.16, N4, P. 296-304.
18. E.V. Bulycheva, A.V. Krek, A.G. Kostianoy. Peculiarities of distribution of oil pollution in the Southeastern Baltic by satellite data and in-situ measurements. Okeanologiya, 2016, Vol. 56, N 1, P. 81-89.
19. E. Bulycheva, I. Kuzmenko, V. Sivkov. Annual sea surface oil pollution of the south-eastern part of the Baltic Sea by satellite data for 2006-2013. Baltica, 2014. Vol. 27. Special Issue. P. 9-14.