


BISAC NAT010000 Ecology
BISAC NAT045050 Ecosystems & Habitats / Coastal Regions & Shorelines
BISAC NAT025000 Ecosystems & Habitats / Oceans & Seas
BISAC NAT045030 Ecosystems & Habitats / Polar Regions
BISAC SCI081000 Earth Sciences / Hydrology
BISAC SCI092000 Global Warming & Climate Change
BISAC SCI020000 Life Sciences / Ecology
BISAC SCI039000 Life Sciences / Marine Biology
BISAC SOC053000 Regional Studies
BISAC TEC060000 Marine & Naval
This study examines relationships between available surface meteorology variables and climatic oscillations by using canonical correlation analysis (CCA). Canonical loadings and cross loadings from CCA are evaluated for meteorological stations located over coastal regions of Colombia. The tests, used for these studies, consider the temperature, the precipitation data, three of the main oscillations – the Ocean Niño Index (ONI), North Atlantic Oscillation (NAO), and the Quasi-biennial oscillation (QBO). The results show the power of the statistical method used to identify associations on the data set with an acceptable level of confidence using multivariate approach. The analysis reveals relations mostly between the variables and the ENSO for all cases and a discrete connection with the NAO and QBO. To add climate indices to the group of independent variables increased the variance rates between 5 and 7%.
Climate variability, atmospheric oscillations, Multivariate analysis, El Niño Southern Oscillation (ENSO).
I. INTRODUCTION
Colombia is located on the equatorial region in the northwestern of South America, bordering to the North with the Caribbean Sea; and to the west with Pacific Ocean. Colombia is the unique South American country which has both Caribbean and Pacific lowlands coastal regions. The Climate of Colombia is tropical and isothermal as a result of its proximity with the Equator, where the trade winds converge. On the other hand the Andes Mountains bring on convective processes and cause variety of climates according to altitude, other general aspects of the climate in Colombia can be found in [1], [2] and [3]. The Intertropical Convergence Zone (ITCZ) migration and El Niño South Oscillation are the main sources of seasonal and inter-annual climate variability in Colombia, however, the influence of other large scale climatic oscillations on the behavior of the surface meteorological variables is not yet fully understood, as mentioned in [4],[5] and [6].
The researches about connection between large scale climatic oscillations and tropical phenomenon contributes to a better understanding of the global climate and better seasonal-to-interannual forecasting, it is also affirmed by [4] and [7]. The main problem to advance in these studies lies in the limited availability of time series whose length allows to study interdecadal and interannual fluctuations. Despite the difficulty several authors have attempted to evaluate the influence of the macroclimatic oscillations in local weather patterns. Some examples are the study of: the North Atlantic Oscillation (NAO) presented in [6] and [8], Quasi-biennial Oscillation (QBO) summarized in [1], [9] and [10]; and El Niño Southern Oscillation (ENSO) which has been the most studied, some representative papers about are [2], [3], [5] and [11].
The NAO index is used to represent this oscillation. It is defined as the normalized difference between the pressure at sea level in Gibraltar and southwest of Iceland Reykjavik. A positive index means an strengthening in the High Azores in the northern hemisphere causing an atypical change in the air temperature, increase in winter and decrease in summer. A negative index implies the opposite process, for more information about NAO consult [6], [8] or [12]. The cross correlation analysis between the NAO and the precipitation in Colombia, described in [6], [8], show a strong and negative association especially in the area of the Atlantic coast and a weaker and positive towards the center and south of the country with a six-month lag correlations; however, authors recommend pursue the subject.
The QBO index is used to represent the QBO phenomenon. It is the direction of zonal wind at 30 hPa level. The fluctuation in the wind direction is measured in the low and medium equatorial stratosphere with a period between 20 to 36 months and an average of 26 months. Some studies as [9],[10] and [13] indicate that QBO can affect the frequency of tropical cyclones in the Atlantic and therefore, the climatic conditions in the northwestern of South America (correlated the QBO phenomenon with the precipitation and the long-wave radiation from various areas of the country without obtaining statistical association, for that reason the authors suggest to use another type of correlation methods. Despite the existence of a quasi-biennial band in rainfall records in the country, there still are few published studies showing the possible link between QBO and hydrology of the country.
Finally, the Ocean Niño Index (ONI) represents the ENOS. The ONI is calculated as the running 3-month mean SST anomaly for the Niño 3.4 region, based on periods of 30 years updated every five. Values above 0.5 for three consecutive months are related to events El Niño and below -0.5 to Niña events. Studies as [2], [3], [5] and [11] show that the relation among ENSO, rainfall, and river flows is strongest during the December-January-February (DEF) and the weakest for the period March- April-May (MAM) These studies also reveal that the impact of ENSO on hydrological variables spreads from west to east. Unlike these studies, this paper proposes the use of canonical correlation between macroclimatic indices such as the ONI, NAO and QBO and variables as the maximum temperature and precipitation.
Canonical Correlation Analysis (CCA):
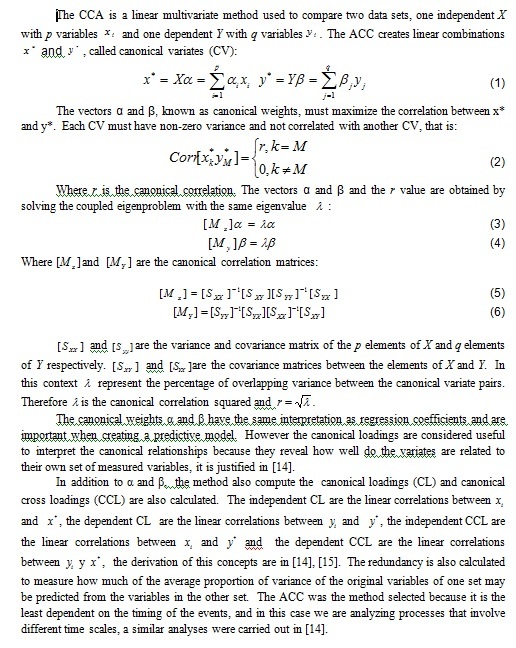
II. METHODOLOGY
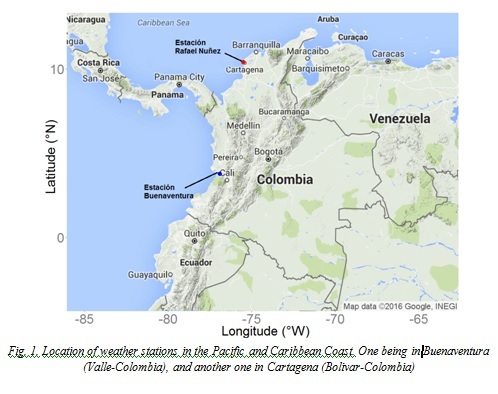
The CCA was implemented to relate the indices of the NAO, ENSO and QBO with the precipitation and maximum temperature obtained from two weather stations, one located in the Pacific coast, being in Buenaventura (Valle), and another one located in Cartagena (Bolivar) on the Caribbean Coast.
The data sets were obtained from the Instituto de Hidrología, Meteorología y Estudios Ambientales de Colombia. Weather stations were chosen for having multiyear monthly data over 30 years in both variables and for having the lowest number of missing data for the period 1982-2012. The indices were obtained from the website of the Earth System Research Laboratory (ESRL, 2014) for the period 1982 to 2012 also.
Time series of precipitation, maximum and minimum temperature were grouped into seasonal values as follows: December January, and February (DJF); March, April, and May (MAM); June, July, and August (JJA); and September, October, and November (SON). According to [15] divide series into seasonal values maximizes the probability to find relationships between climate index and meteorological variables. The dependent data set was composed of the seasonal series of precipitation, maximum and minimum temperature, and the independent of all four seasons of the climate indices.
To identify which combination of indexes shows the highest correlations two different tests using CCA were carry out. NAO and ONI index were the independent variables in first test and NAO, ONI and QBO in the second one. Both test were performed for each weather station and seasonal serie, it means that the CCA script was run 16 times.
F test was performed with the approach of Rao and statistically significant results were accepted with a confidence level of at least 90%. For each ACC were estimated the vectors α and β, canonical correlation (r), canonical loadings (CL) and canonical cross loadings (CCL), redundancy coefficients and reliability percentages. There is no a universal standard of significance to consider canonical correlations obtained from an ACC, so the expert must interpret the results regarding the nature of the physical processes and their own experience. According to [15] a threshold of 0.4 for dependent cross loadings, and 0.2 for independent cross loadings were considered. Besides any variable must share at least 16% of the variance with the respective variate and only the loadings that meet the 95% statistical significance are used.
The results were summarized in bar charts, the height of each bar is the product between the dependent loading multiplied and the independent cross loading that were statistically significant and above the thresholds mentioned. As it was mentioned above, the dependent loadings are the linear correlations between precipitation and maximum and minimum temperatures with its respective variate or canonical variable. And independent cross loadings are the linear correlation between the climate indexes and the dependent canonical variable (i. e. linear combinations of precipitation , maximum and minimum temperature). Multiplying these two loads allows identifies the degree of relationship between each index and the observed variables. For this work it was written a code in R version 2.14.2, which allowed to run all the 16 analyses. The code was written to evaluate the original data, to build the seasonal series, select the values according to the thresholds and display the results in bar charts.
III. RESULTS
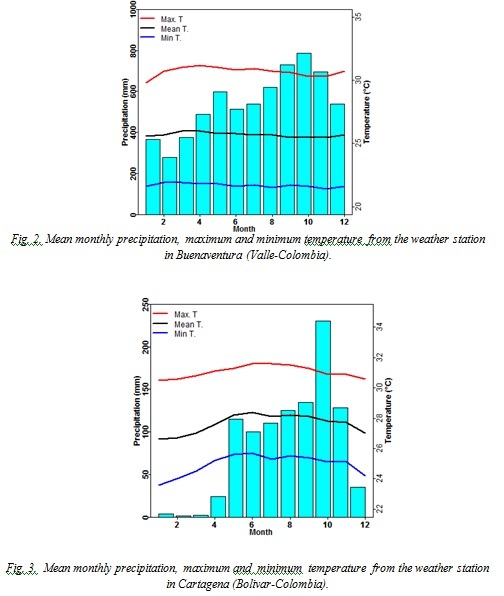
The mean monthly precipitation, maximum and minimum temperature for both weather stations is showed in Fig. 1 and 2. Buenaventura is one of the rainiest places in the world with 6000–7000 mm per annum. Precipitation in Buenaventura has a bimodal annual cycle with two maximum around April-May and the second peak around October-November. This behavior corresponds with the displacement of the intertropical convergence zone (ITCZ). The mean temperature is 25.8 ° C, with the lowest monthly average values during November to January and the highest during March to May. The average maximum and minimum temperature varies around 33.1°C and 19.7°C respectively.
The annual rainfall in Cartagena is around 912 mm per annum. Precipitation in Cartagena has only one long rainy season, from May through November. The mean temperature is 27.7 ° C, with the lowest monthly average values during November to March and the highest during May to September. The average maximum and minimum temperature varies around 31.5°C and 24.2°C respectively.
The canonical correlations and proportion of variance explained for test one are summarized in Table 1. The proportion of variance of meteorological variables explained by the NAO and ONI index rates between 24% and 42 % in the period DEF, between 15% and 35% in MAM, between 22% and 30% in JJA and between 38% and 40% during SON.
Table 1. Canonical correlation coefficients (r ) and variance explained for each CCA test.
|
|
DEF |
MAM |
JJA |
SON |
|||||
|
|
r |
v |
r |
v |
r |
v |
r |
v |
|
|
Test one |
|
|
|
|
|
|
|
|
|
|
Buenaventura |
0.86 |
0.42 |
0.66 |
0.35 |
0.74 |
0.22 |
0.82 |
0.38 |
|
|
Cartagena |
0.7 |
0.24 |
0.57 |
0.15 |
0.63 |
0,3 |
0.85 |
0.4 |
|
|
Test two |
|
|
|
|
|
|
|
|
|
|
Buenaventura |
0.9 |
0.55 |
0.7 |
0.46 |
0.81 |
0.35 |
0.86 |
0.47 |
|
|
Cartagena |
0.75 |
0.36 |
0.8 |
0.30 |
0.72 |
0.40 |
0.82 |
0.45 |
|
The season with the highest percentages is DEF, followed by SON. The lower correlation coefficients and explained variance percentages were obtained in the case of Buenaventura and the largest in Cartagena. The difference in the results obtained in these two cases is explained by the contrast of the hydrological cycle between the two places. In Buenaventura the precipitation cycle is controlled primarily by the ITCZ but also for the equatorial west monsoon present in the northwestern of South America, as mentioned in [11] ; In Cartagena rainfall response to the ITCZ migration and to the influence of the ocean–atmospheric processes in the Tropical Atlantic.
The numbers next to the label of the indices in Fig. 4 make reference to the period, 1 corresponds to DEF, 2 to MAM, 3 to JJA and 4 to SON. The follow results were common for all places: During DEF significant associations between meteorological variables with ONI1, ONI3 and NAO1y NAO3 were obtained. In season MAM only the variables from Cartagena showed to be related to NAO3. In JJA only maximum and minimum temperature from Cartagena showed to be related to NAO3. In season SON significant associations between meteorological variables with ONI1, ONI2 ONI3, ONI4 were obtained.
In general, the higher canonical loadings occur between the ONI index and the variables over DEF in Cartagena. And the lowest values are obtained between the NAO and variables of Buenaventura. Season MAM is the period with non- significant relations among large scale oscillations, temperature and precipitation in coastal regions of Colombia. The results are according with [2], [6] who obtained the highest significant cross-correlations between ENSO and hydrological variables during DEF season, and non-significant for period MAM.
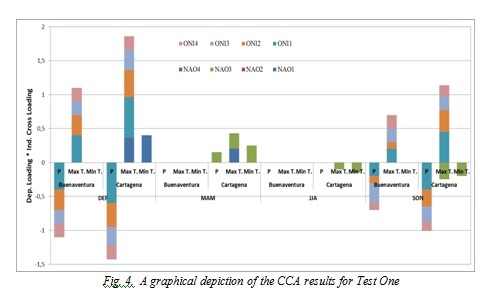
Fig. 4. A graphical depiction of the CCA results for Test One
The results also correspond with the physical phenomenon, for example, a positive ONI (associated with the Niño event) is related to a decrease in rainfall and a rise in maximum temperature. It also happens that the relationship between ONI and meteorological variables has a three to six-month lag. This corresponds to the fact that the ENOS spreads from west to east and it takes cross the Pacific equatorial about six months.
The relation between NAO index and meteorological variables is coherent with results in [15]. They report that the influence of the NAO changes depending on time of year and do not follow a definite pattern. The relationship with NAO can be understood considering that the NAO affects the intensity of trade winds from the northeast and therefore the displacement of the ITCZ over the tropical Atlantic, modifying the moisture transport from the tropical Atlantic to the Americas and convective activity. The effect of NAO on-year band on precipitation appears to be limited.
In the second test, with QBO in the group of independent variables, the proportion of variance of meteorological variables explained by the indices was slightly higher. Values ranged between 36% and 55% in the period DEF, between 30% and 46% in MAM, between 35 and 40% in JJA and between 38% and 41% during SON.
The bart chart obtained for the second test was similar to Fig. 4, the climate oscillation with higher connection to the variables was the ONI. In all cases the relationship was directly and indirectly with the maximum temperature with the precipitation, with greater weight for DEF and SON. As for the NAO canonical charges had the same meaning as in the first test but were lower in magnitude. The only difference with the first test was the sign of the QBO appeared slightly related to precipitation.
This slightly additional relationship that appears between QBO and seasonal series explains the slight increase between 3 and 7% of the variance explained by climatic oscillations. The QBO reaches its greatest extent in the stratosphere, the most accepted hypothesis is that its existence is associated with the displacement of equatorial Rossby-Gravityand kelvin waves. The QBO is related to the frequency of cyclones in the Atlantic or to the ENSO cycle, so it is possible to observe the signal in Colombia. The importance of this work is that the results found by CCA are consistent with the physical processes and correlation with previous studies performed. This implies that the method is an alternative to identify simultaneous relations as also suggest [14]. The canonical correlations are not very large because the variance explained by climatic oscillations is generally small.
IV. CONCLUSIONS
The work shows that the CCA identifies partnerships through a multivariate approach of macroclimatic indices as predictors. The consistency of the results found with the physical processes and preliminary studies of correlation. In general the results of both tests reaffirm the influence of ENOS on both Caribbean and Pacific lowlands coastal regions, but lower in the Pacific region. The relationship is inverse to precipitation and direct with the maximum temperature; the highest correlations occur over DEF and the weakest during MAM. The relationship between the climate index and meteorological series is provided by the ONI, followed by the NAO and a more discreet contribution of the QBO was obtained.
1. A. Carmona. and G. Poveda. “Application of hilbert-huang transform to detect hydroclimatic variability modes in Colombia”. DYNA. Colombia, vol. 79(175), pp. 72-80, 2012.
2. G. Poveda, D.M. Alvarez, O.A. Rueda. “Hydro-climatic variability over the Andes of Colombia associated with ENSO: a review of climatic processes and their impact on one of the earth's most important biodiversity hotspots”. Climate Dynamics. Germany, vol. 36(11), pp. 12233-2249, 2011.
3. N. Hoyos, J. Escobar, J.C. Restrepo, A.M. Arango, J.C. Ortiz.. “Impact of the 2010-2011 la Niña phenomenon in Colombia, South America: the human toll of an extreme weather event”. Applied Geography. Netherlands, vol. 39, pp. 16-25, 2013.
4. I. Fonseca, A. Cavalcanti, “Large scale and synoptic features associated with extreme precipitation over south america: a review and case studies for the first decade of the 21st century”. Atmosph. res. Netherlands, vol. 118, pp.27-40. 2012.
5. M. Henríquez. Climatología ambiental de Colombia. Ed. Universidad Santo Tomás, bogotá (Colombia), p. 330, 2012.
6. G. Poveda, J. Vélez, O. Mesa, C. Hoyos, I. Salazar, O. Barco, P. Correa. “Influencia de fenómenos macroclimáticos sobre el ciclo anual de la hidrología Colombiana: cuantificación lineal, no lineal y percentiles probabilísticos”. Meteorol. colomb. Colombia, vol. 6, pp. 121-130, 2002.
7. C. Vera, M. Barange, O.P. Dube, I, Goddard, l. D. Griggs, N. Kobysheva, E. Odada, K. Trenberth,. “Needs assessment for climate information on decadal timescales and longer. procedia environm”. sci. Netherlands. vol. 1(1), pp. 275-286, 2010.
8. G. Poveda, M. Gil, N. Quiceno, “El ciclo anual de la hidrología de Colombia en relación con el ENSO y la NAO”. bull. inst. fr. études andines. France, vol. 27(3), pp. 721-731, 1998.
9. J. A. Zea, G. León, J.A. Eslava. “La Oscilación Cuasibienal y algunas relaciones con los eventos cálidos y fríos del pacifico”. meteorol. Colomb, Colombia. vol. 1, pp. 51-58, 2000.
10. M. Zuluaga, J. E. Posada, G. Poveda. “Relación entre las fases de la oscilación cuasibienal, la precipitación mensual y la radiación de onda emergente en Colombia. Available in: http://www.bdigital.unal.edu.co/4416/1/aa3318
11. S. Córdoba-Machado, R. Palomino-Lemus, S.R. Gámiz-Fortis, Y. Castro-Díez, M.J. Esteban-Parra. “Influence of tropical pacific SST on seasonal precipitation in Colombia: prediction using el Niño and el Niño Modoki”. Climate dynamics, Germany. vol. 44, pp.1293-1310, 2014.
12. E. Zorita, V. Kharin, H. V. Storch, “The atmospheric circulation and sea surface temperature in the North Atlantic area in winter: their interaction and relevance for Iberian precipitation”. j. clim, vol . 5, pp. 1097-1107, 1991.
13. M. P. Baldwin, I. J. Gray, T.J. Dunkerton. “The quasi-biennial oscillation”. rev. geophys, EE.UU, vol. 39(2), pp.179-229, 2001.
14. A. Singh, N. Acharya, U. C. Mohanty, G. Mishra. “Performance of multi model canonical correlation analysis for prediction of Indian summer monsoon rainfall using GCMS output. Computes” rendus geosc, France, vol. 345(2), pp. 62-72, 2012.
15. K. Stevens and P. H. Ruscher, “Large scale climate oscillations and mesoscale surface meteorological variability in the Apalachicola Chattahoochee-flint river basin”. j. hydrology, vol. 517, pp. 700-714, 2014.