


BISAC NAT010000 Ecology
BISAC NAT045050 Ecosystems & Habitats / Coastal Regions & Shorelines
BISAC NAT025000 Ecosystems & Habitats / Oceans & Seas
BISAC NAT045030 Ecosystems & Habitats / Polar Regions
BISAC SCI081000 Earth Sciences / Hydrology
BISAC SCI092000 Global Warming & Climate Change
BISAC SCI020000 Life Sciences / Ecology
BISAC SCI039000 Life Sciences / Marine Biology
BISAC SOC053000 Regional Studies
BISAC TEC060000 Marine & Naval
Images of satellites OrbView-3 for 2004 and 2005 years (spatial resolution 1 m/pixel) and Pleiades for 2014 year (spatial resolution 0.5 m/pixel) for the Vistula Lagoon (the Baltic Sea) were used. In contrast to shoreline location often used as an indicator of a shore retreat the paper recommends to use the changes in location of dune edge as an indicator of shore dynamics. Nine well identified mark points were selected for the northern Russian part of the Vistula Spit as control ones. The average difference in locations of these points obtained by geodetic survey and satellite images was 0.4 m. The lines of the foredune edge for 25 km northern part of the Vistula Spit (from the Polish-Russian border to the Strait of Baltiysk) for 2004-2005 and 2015 were digitized with the step of 10 m and compared. Introducing the level of confidence ± 1.5 m per 10 years, we considered that eroded, stable and accreted parts of the shore have the total length 15.4, 4.9, 5.2 km (60.4%, 19.1%, 20.5%). The average (10 years) erosion rate for the marine shore on the Russian side of the Vistula Spit is 0.6 m/year, and accretion rate is 0.3 m/year. Maximum erosion rate (2.2 m/year) was revealed on the shore segment to south from the Strait of Baltiysk, which is under permanent erosion during last one century and a half after construction of the entrance jetties. The comparison of result of geodetic instrumental monitoring and estimation using satellite images showed that the second method slightly underestimates the shoreline displacement. Also it was shown that instrumental monitoring measurements at the profiles with spatial step of several kilometers are not optimal enough to reveal erosion/accretion processes for the shore of South-Eastern Baltic, which is characterized by alongshore nonmonotonic variations of shoreline dynamics parameters.
coastal dynamics, erosion rate, remote sensing, Vistula Spit
I. Introduction
The Vistula Spit is located in the south-eastern part of the Baltic Sea and borders the Vistula Lagoon (Fig. 1). It is transboundary sandy barrier peninsula, southern 40 km belong to Poland and northern 35 km belong to Russia (Kaliningrad Oblast). The single inlet to the Vistula Lagoon (the Strait of Baltiysk[1]) cuts the spit in 2 parts on Russian territory (25 to south and 10 km to north from the inlet).
Sandy beaches on the marine shore have width of 40-50 m in the central part and 20-25 m in the northern part of the spit. The continuous alongshore foredune borders the beach and forested area, it was formed by natural eolian accumulation. The ancient dunes are located at the lagoon shore, they have a height 7-12 m at the northern part and up to 30 m at the southern and central parts. The beaches at the lagoon shore are very narrow – 5-15 m [1].
Instrumental geodesic monitoring [2] was started on the marine and lagoon shore by AB IO RAS[2] in 2002, while some test measurements were done in 2000. This type of monitoring has rather good accuracy but doesn’t cover the whole shore. It is fulfilled via measurements along the profile perpendicular to the shoreline, and doesn’t consider what happened with the shore between the measuring profiles. It appeared that the method is not optimal enough for the shore of South-Eastern Baltic, characterized by alongshore nonmonotonic variations of shoreline dynamics parameters.
Nowadays step in development of coastal monitoring is connected with satellite images [3,4,5]. This method became applicable for the Baltic Sea shore only recently, once the satellite images with resolution about 1-2 m became accessible, as the crucial point to apply this method is the comparability between satellite image resolution and rate of shore erosion.
The aim of the study – to estimate quantitatively the dynamics of marine shore of the Russian part of the Vistula Spit (erosion or accretion) and changes of coastline location in space and time using the satellite images of high resolution.

|
Fig. 1. Location of the Vistula Spit in the south-eastern part of the Baltic Sea. |
II. Materials and methods.
The images of extra high spatial resolution from the satellites OrbView-3 and Pleiades were used to estimate quantitatively the dynamics of marine shore of the Vistula Spit (erosion or accretion) and changes of coastline location in space and time.
Satellite images of the OrbView-3 is panchromatic images with spatial resolution 1 m/pixel. Four images of the OrbView-3 satellite were used: 1 image for August 2005 and 3 images for August-September 2004 (Fig. 2). Due to absence of the images of the same year to cover the whole research area, the image for 2004 was combined with image 2005 for northern part of the area. The uncertainty caused by this combination of initial location of the coastline was supposed to be within the uncertainty of estimation made in this paper, and gave the little underestimation of erosion rate in the northern part of the area.
Satellite natural color images of the Pleiades with spatial resolution 0.5 m/pixel (five images for September 2014) were used.
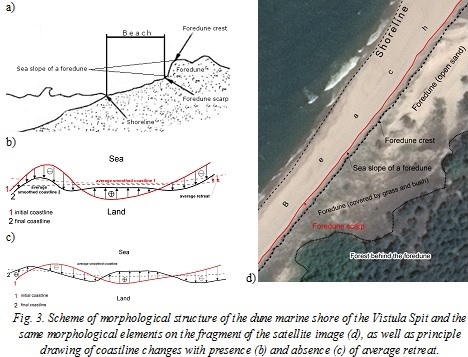
In the paper we considered the change in location of the foredune scarp as an indicator of the coastline erosion if the foredune scarp retreated or the accretion if the foredune scarp moved forward towards to the sea.
Foredune scarp (Fig. 3a) is the line between upper part of a beach and lower part of a sea slope of the foredune. It is better visible on the satellite images than the foredune crest, which is usually used as an indicator for coastal retreat [2]. These two approaches to estimate the coastline retreat via the change of location of the lines of both dune scarp or dune crest may lead to different estimation of erosion/accretion rate for the same point of the shore. Dune crest may be stable, but dune scarp may retreat due to wave erosion, or vice versa, the dune scarp may be stable, but dune crest retreat due to wind deflation. We are expected that in long-term perspective these two approaches should give the same result.
Foredune scarp is easy visible on the satellite image as the border between beach and vegetation if the seaward slope of the foredune is covered by vegetation. Otherwise the foredune scarp is visible as the border between the area with maximal brightness on the satellite images (it is a beach) and neighbor area landward having less brightness or another texture (Fig. 3).
The following steps were made to estimate quantitatively the dynamics of marine shore of the Vistula Spit (erosion or accretion) via changes of coastline location in space and time:
- To make georeference of the satellite images using control points method. Images for 2004 were superposed with images 2014 by control points (crossroads, corner of buildings and detached trees).
- To digitize the positions of the foredune scarp on images with an accuracy of 1 pixel.
- To measure the distance between positions of the foredune scarp in 2004 and 2014 years, as the indicator of the dynamics of marine shore. The distance between locations of the foredune scarp in 2004 and 2014 years were measured at the points selected with 10 meters interval along the line of the foredune scarp in 2014. So, the shore displacement was measured as the distance from points on foredune scarp line in 2014 to the line of the foredune scarp in 2004. In the GIS instrument the lines were parameterized from north to south, and therefore, the points of 2014 located to left from foredune scarp line in 2004 were attributed as erosion points while points locate to right from foredune scarp line in 2004 were attributed as the accretion ones.
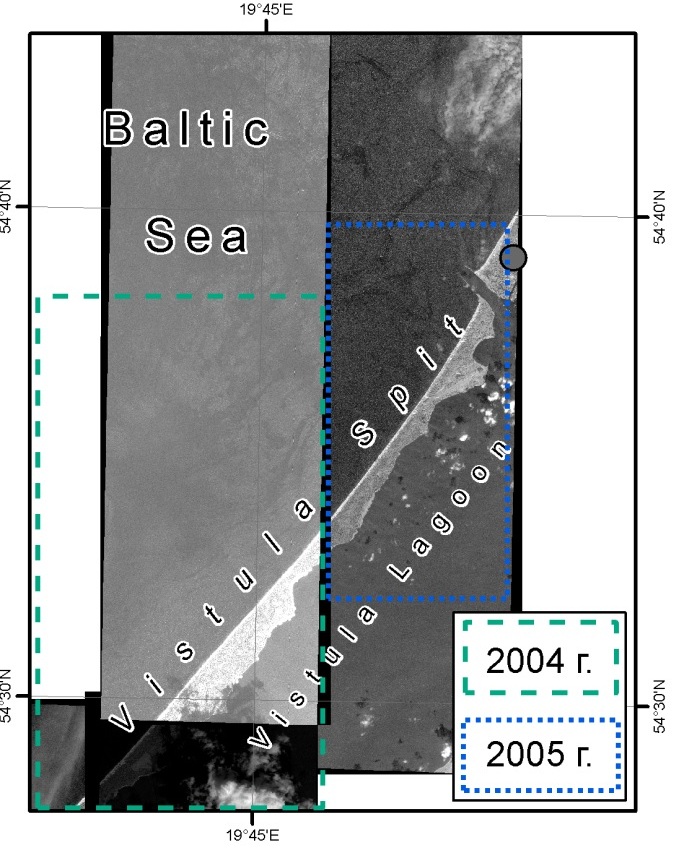

Fig. 2. The coverage of the Russian part of the Vistula Spit by satellite images of the OrbView-3 of 2004 and 2005 (a), and locations of the monitoring points at the marine shore of the Vistula Spit (b).[1] Some studies call it the ‘Baltiysk Strait’
The confidence range was introduced for more accurate estimation of shore dynamics – the shore segment was attributed as stable if the value of the displacement was lees then confidence range. We considered the confidence level of coastline retreat between -1.5 m and +1.5 m for given period 2004-2014 as the spatial resolution of the images were 1 m/pixel and 0.5 m/pixel, and the maximal error could be equal to 1.5 m. It followed by the confidence range (from -0.15 m/year to +0.15 m/year.) for the average annual shore dynamic rate.
The values of coastline displacement during 10 years period (2004-2015) obtained both from instrumental monitoring [6,7] and satellite images are presented in Table 1. The comparison was made for 9 monitoring profiles of the AB IO RAS monitoring network (Fig. 2). Mean difference between monitoring and satellite data was -0.7 m, i.e. it seems, that method based on the satellite images underestimates the coastline retreat. The maximal difference of 2-2.5 m was observed for profiles 16p, 5mv, 4mv. Partly it may be the consequence of refereeing the initial data of 2005 (profiles 5mv, 6mv, 16p, 15p, 9p, 2p) to 2004.
Table 1. The coastline displacement at the monitoring profiles during 10 years period 2004-2015 obtained from satellite images and instrumental monitoring. Retreat is marked by negative displacement, accretion – by positive.
|
№ of profile |
Displacement by monitoring, m |
Displacement by satellite image, m |
Difference between ‘monitoring’ and ‘image’, m |
|
2p |
-11,0 |
-10,0 |
-1,0 |
|
9p |
0,5 |
1,0 |
-0,5 |
|
15p |
3,0 |
2,0 |
1,0 |
|
16p |
-11,0 |
-8,5 |
-2,5 |
|
6mv |
5,1 |
4,5 |
0,6 |
|
5mv |
-4,8 |
-2,5 |
-2,3 |
|
4mv |
-11,0 |
-9,0 |
-2,0 |
|
2mv |
-1,0 |
-2,0 |
1,0 |
|
1mv |
-7,5 |
-7,0 |
-0,5 |
|
Average |
-0,7 |
||
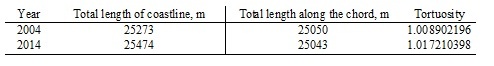
To investigate the differences in coastal changes caused by average coastal retreat and change of coastline tortuosity (Fig. 3 b,c) the GIS based procedure of average smoothing (30 m window) of both digitized coastlines of 2004 and 2015 was applied. The tortuosity (dimensionless value) is expressed by arc-chord ratio of the length of the coastline (L) to the distance between the ends of it (C): τ=L/С [8].
III. Results and discussion
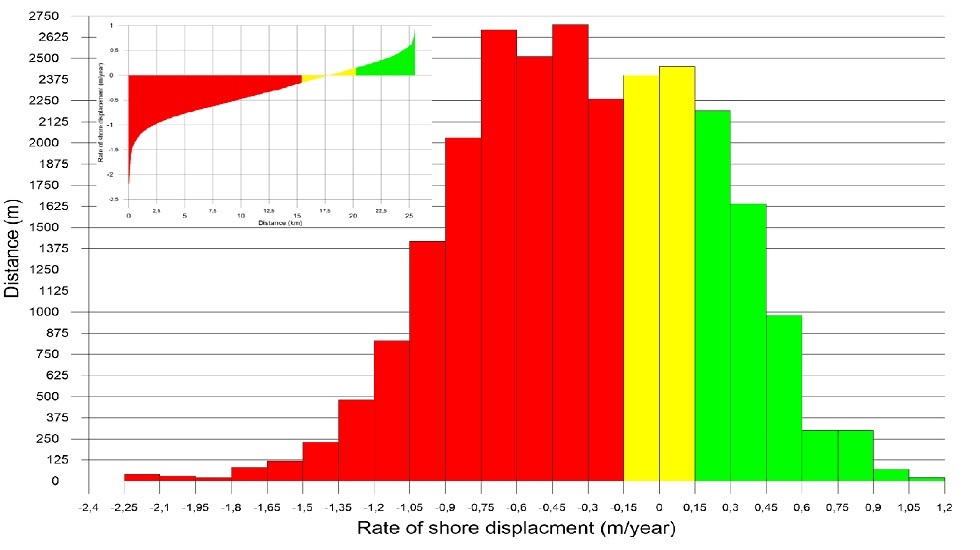
Considering the series of 10-years displacement for all points of the studied shore, one may represent this series in terms of distribution of the total length of all shore segment against the erosion (-) or accretion (+) rate (ranges with the step of 0.15 m/year) (Fig. 4). The inset of Fig.4 presents the same information (sorted by rate) but along the cumulative length. The characteristic feature is that the shore segments of nearly the same total length (2000 – 2650 m) are attributed to the ranges of the erosion/accretion rate within the limits of -0.9 – 0.3 m/year (linear relationship on the insert of Fig. 4) and occupy the major part of the spit shore.
Fig. 5 demonstrates the variations of 10-years average shore dynamics rate for the marine shore of the Vistula Spit from the Polish-Russian border up to the Strait of Baltiysk for the period 2004(2005) – 2014. Erosion and accretion segments change each other rather irregularly. This is absolutely new level of understanding of shoreline dynamics, as results of instrumental monitoring [6,7] gave the uncertain picture: no one from monitoring profiles (they are indicated in Fig. 5) locates at the shore segment of high rate of changes, most of them are within the zones of a low rate of erosion/accretion. That is why the very general conclusion came from the instrumental monitoring program [6,7]: the segment of 4-5 km south from the Strait of Baltiysk is intensively eroded while the rest shore to south is in stable conditions in general
[2] - Atlantic Branch of P.P.Shirshov Institute of Oceanology of Russian Academy of Sciences, Kaliningrad, Russia
As it is seen from the Fig. 4 and 5, the significant part of shore of the Vistula Spit is under erosion of different extent. The average 10-years erosion rate (2014-2014) for the marine shore on the Russian side of the Vistula Spit is 0.6 m/year, and accretion rate is 0.3 m/year.
The length of eroded coastline is 15.4 km (60.4%): 5.8 km (22.7%) has the rate less than 0.5 m/year, 7.4 km (29.1%) has the rate 0.5-1.0 m/year, 2.1 km (8.4%) has the rate 1.0-2.0 m/year, 0.07 km (0.3%) has the rate higher than 2.0 m/year. The length of single eroded shore segment varies in a range 20-1450 m, 390 m is the average length.
The total length of the stable shore segments is 4.9 km (19.1%), they are characterized by the rate of erosion or accretion not less 0.15 m/year, as this rate is less than resolution of our method. The length of single stable shore segment varies in a range 20-240 m, 70 m is the average length.
The accretion was identified at 5.2 km (20.5%) in total, where 3.8 km (15%) was characterized with accretion rate 0.15-0.5 m/year, and nearly 1 km (4.2%) had accumulation with the rate 0.5-1 m/year. The length of single accreted shore segment varies in a range 20-530 m, 150 m is the average length.
Considering the rate 1 m/year as the threshold of erosion for the shores of South-Eastern Baltic, someone may define 3 shore sections (A-B-C) with the rate higher this threshold (Fig. 5). The longest one (A) is 7 km south from the Strait of Baltiysk. Here the maximum erosion rate (2.2 m/year) was identified. The shore segment with this rate has a length 70 m and is located at the southern end of the 2-kilometers shore segment belonged to the territory of the Kosa Settlement.
The length of the single eroded and accreted segment of the section A varies in a range 70-570 m and 30-180 m respectively. For sections B and C the length of single eroded and accreted segment varies in a range 200-1800 m and 50-700 m respectively, i.e. not so often as for the section A.
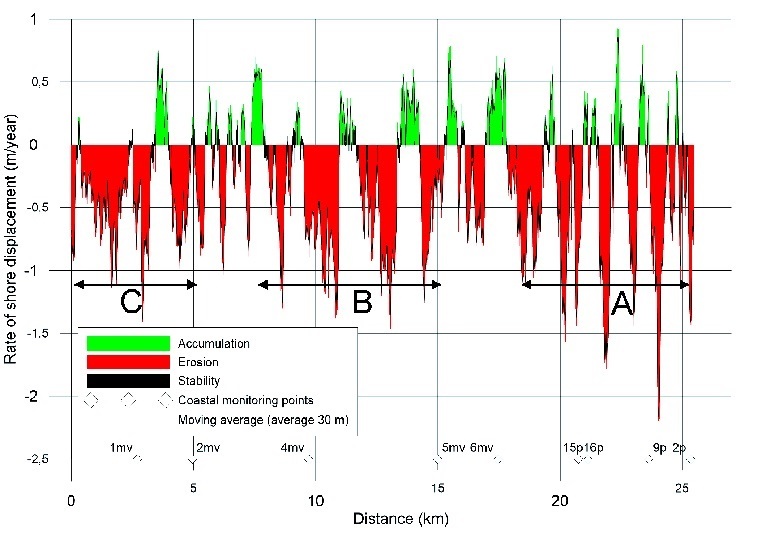
Fig. 5. Rate of shore displacement for the Russian side of the marine shore of the Vistula Spit averaged through the period 2004-2014. Three shore segments (A,B,C) with erosion rate higher than threshold of 1/year were identified. The rate obtained by analysis of displacements of smoothed coastlines (30 m window) very well fits to the rate basing on unsmoothed data
Analysis of the coastline tortuosity for 2004 and 2015 (Table 2) showed that the coastline of 2014 became tiny more variable in space. The analysis of changes of coastline basing on averaged smoothed coastlines of 2004 and 2014 gave the same result for average length of eroded and accreted segments. The erosion/accretion rate estimated by displacement of averaged smoothed coastline very well fits to the one estimated by unsmoothed data (Fig. 5). It means that smoothed data well present the real situation and may be compared with any satellite image of rough resolution (up to 30 m per pixel).
Table 2. Tortuosity for coastlines 2004 and 2014
IV. Conclusions
The uncertainties of the analysis of coastal dynamics using satellite images depend on ratio between the image resolution and rate of shore displacement. For the marine shore of the Vistula Spit located in the South-Eastern Baltic we have used the images with resolution 0.5-1 m/pixel for 10 years period (2004-2014). The change in location of the foredune scarp was used as an indicator of the coastline erosion/accretion. Introducing the level of confidence for displacement rate as ± 1.5 m per 10 years, we considered 19.1% (4.9 km) of length of coastline as stable (displacement was not higher than level of confidence).
Comparison of results of coastline displacement obtained by direct geodesic measurements and from satellite images at the 9 test profiles showed:
- for the shore segments where accretion dominates (3 profiles) the data obtained from satellite images gave less positive displacement than geodesic data (for 2 profiles among 3 ones);
- for the shore segments where erosion dominates (6 profiles) the data obtained from satellite images gave less value of displacement than geodesic data (for 5 profiles among 6 ones), the difference varies in the range 0.5-2.5 m per 10 years.
No one from monitoring profiles coincide with shore segment with high rate of shoreline displacement, most of them are located within the zones of medium and low rate of erosion/accretion. It means that monitoring results doesn’t include important information about high value of changes happened at the shore segment between the monitoring profiles. The result once more showed that nowadays instrumental monitoring by measurements at the profiles with spatial step of several kilometers is not optimal enough for the shore of South-Eastern Baltic, which is characterized by alongshore nonmonotonic variations of shoreline dynamics parameters. New monitoring system with profiles each 500 m introducing by the State Organization of the Kaliningrad region "Baltberegozaschita" will better present the variability of coastal dynamics, but the using of satellite images anyway is the best method to get information about whole shoreline dynamics.
Erosion is the predominant process on the marine shore of the Vistula Spit in terms of both eroded length of shoreline and rate of displacement. Eroded, stable and accreted parts of the shore have the total length 15.4, 4.9, 5.2 km (60.4%, 19.1%, 20.5%). The average (10 years) erosion rate for the marine shore on the Russian side of the Vistula Spit is 0.6 m/year, and accretion rate is 0.3 m/year. Analysis of tortuosity and retreat of averaged smooth coastline showed that for the Russian side of the marine shore of the Vistula Spit the displacement of coastline is caused by average retreat and shift, not by increasing the tortuosity.
Spatial variability of erode/accreted segments of the shore is high. Using threshold of 0.6 m/year and 0.3 m/year for eroded and accreted segments we may reveal 19 eroded ones and 14 accreted ones, which change each other (there are stable segments also). The length of these segments varies in the ranges 70-1800 m (eroded ones), 20-160 m (stable ones), 30-700 m (accreted ones). It is expected that these segments are not stably located in space otherwise the shore will be extremely meandering through thousands of years of existence of the spit.
Maximum erosion rate (2.2 m/year) was revealed on the shore segment to south from the Baltiysk Strait, which is under permanent erosion during last one century and a half after construction of entrance moles.
V. Acknowledgement
Technical facilitation of the study and problem identification were made under support of the theme № 0149-2014-0017 (supervisor – B. Chubarenko) of State Assignment of the P.P.Shirshov Institute of Oceanology of the Russian Academy of Sciences (2015-2017). The preparation of this article was made under the support of the Project No 14-17-00547 “A forecast development for evolution of accumulative Russian coasts of tide less seas”
1. E. N. Badyukova, L. A. Zhindarev, S. A. Luk’yanova, and G. D. Solov’eva, “The geological-geomorphological structure of the Baltic (Vistula) spit,” Oceanology, vol. 51, No 4, pp. 632-639, August 2011.
2. V.P. Bobykina, V.L. Boldyrev, “Methods of monitoring of the Kaliningrad Oblast,” Proc. XXII Int. Conf. Problems of management and sustainable development of marine coastal zone, Gelendzhik (Russia), p.52, 16-20 May 2007. In Russian.
3. A.E. Tsygankova, “Mathods of analysis of satellite images for study of the shore of the northern-east part of the White Sea,” Proc. Int. Conf. devoted to 100 years anniversary of V.V. Longinov “Lithodynamics of the bottom contact zone of the ocean,” Moscow (Russia), Moscow: GEOS, p. 168, 14- 19 September 2009. In Russian.
4. R. D. Kosyan, Y. N. Goryachkin, and E. A. Godin et al., “Crimea and Caucasus accumulative coasts dynamics estimation with using satellite pictures,” Turkish Journal of Fisheries and Aquatic Sciences. Vol. 12, pp. 385-390, 2012.
5. A. Santra, Mitra S. Santra, and D. Mitra, “Change detection analysis of the shoreline using Toposheet and Satellite Image: A case study of the coastal stretch of Mandarmani-Shankarpur, West Bengal, India,” Int. J. of Geomatics and Geosciences, Vol. 3, Issue 3, pp. 425-437, 2013.
6. V.P. Bobykina, K.V. Karmanov, “Dynamics of the shore of the Gulf of Gdansk and relations with anthropogenic influence,” Proc. Int. Conf. “Construction of artificial beaches, islands and other constructions in coastal zone of seas, lakes and reservoirs,” Novosibirsk, SB RAS, pp. 119-124, 20-25 July 2009. In Russian.
7. V.P. Bobykina, K.V. Karmanov, “To Geoecology of the Kaliningrad Region’s Coast (according to the monitoring results)”, Transactions of the Kaliningrad State Technical University, No 35, pp. 44-54, 2014. In Russian.
8. Tortuosity in 2D. Tortuosity: article in Wikipedia. [https://en.wikipedia.org/wiki/Tortuosity] 23.05.2016.