


BISAC NAT010000 Ecology
BISAC NAT045050 Ecosystems & Habitats / Coastal Regions & Shorelines
BISAC NAT025000 Ecosystems & Habitats / Oceans & Seas
BISAC NAT045030 Ecosystems & Habitats / Polar Regions
BISAC SCI081000 Earth Sciences / Hydrology
BISAC SCI092000 Global Warming & Climate Change
BISAC SCI020000 Life Sciences / Ecology
BISAC SCI039000 Life Sciences / Marine Biology
BISAC SOC053000 Regional Studies
BISAC TEC060000 Marine & Naval
To determine the long-term dynamics of the Anapa bay-bar we analyzed aerial photographs 1941-1944, satellite images of 1960-80s and from 2003 to the present. In the analysis of the long-term variations in the water edge one has to take into account the configuration of the shoreline at the moment of survey and local short-term dynamics. The average value of the water edge displacement over 47 years was 23 m in the direction to the coast. There are areas of severe erosion on the northern and southern parts. The central part of the bay-bar can be called relatively stable. Regions of comparable erosion and accumulation alternate here. The obtained data clarified and gave a more detailed estimate of the evolution of the coastline dynamics of the Anapa bay-bar.
seacoast, long-term dynamics, Anapa bay-bar, remote sensing method.
I. Introduction
The Anapa bay-bar is an accumulative body with length approximately 47 km situated in northwestern part of the Caucasian Black Sea coast. As distinct from most other similar accumulative structures on non-tidal coasts in the Black and Baltic seas, this bay-bar is subjected to intense economic (recreation) development [1]. At the same time, its lithodynamic system has avoided substantial technogenic transformations and thus represents a favorable object for the investigation of natural processes and their regularities. Many researchers have dedicated their investigations to different aspects of the origin and evolution of the Anapa bay-bar [2, 3, 4]. In these and other works, their authors report on the retreat of the shore of the bay-bar during recent decades, although they do not give data on the exact rates and scales of erosion. Inasmuch as such data on the dynamics and stability of the bay-bar are needed for planning economic activity in its limits and protection of these morphostructure [1], additional investigation in this region is urgent. The work is dedicated to the study of the dynamics of different periods of the water edge and the tendencies of its changes using advanced methods.
The bay-bar is a polygenetic accumulative coastal form. The accumulative body of the Anapa bay-bar is created by Kuban river early alluvium. Kuban River alluvium has ceased to arrive on the sea coast after raising of sea level during Holocene transgression. The bay-bar nourishment is made by the deposits of Taman Peninsula abrasion coast and biogenous material (shells and a shelly detritus) in the last several thousands of years. In present time the Anapa bay-bar lithodynamics system is accumulative-erosion system with length about 60 km. Both in the past and currently the Anapa bay-bar combines in development the sediment migrating in transverse and longitudinal directions [2, 3, 5, 6].
The longitudinal sediment movements are very considerable but are multidirectional. Alongshore sediment movement to the south-east prevails. As a result of cross-shore sediment migrations the difficult and dynamic system of underwater bars is created. The active exchange by deposits between the beach and underwater bars is observed. Besides there are developed coastal eolian forms throughout bay-bar. The width of dune windrows with different age reaches 1 km, height of separate dunes exceeds 15 m.
Beginning from 2010, researchers of the Southern Branch of the Institute of Oceanology have been conducting complex investigations of the Anapa bay-bar [7, 8, 9]. The goal of this work is researching of different components of the bay-bar geosystem and estimation of its stability related to the variations in the external conditions. For the systematization and spatial binding of these data “virtual” (since no permanent reference marks are available on the bay-bar) reference points are used, located near the average position of the water edge at distances of 1 km (Fig. 1). These points are crossed by reference profiles extending transversely to the shoreline; along these profiles various data are gathered. The most important element of these researches is identification of a long-term trend of sea coast development. As the bay-bar coast is in highly dynamical for determination of its long-term development tendencies it is necessary to analyze the data over the maximum possible time.
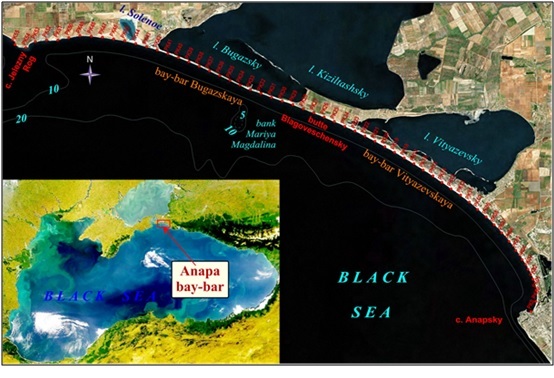
Fig. 1. Scheme of the Anapa bay-bar and location of reference profiles (modified from [10)]).
II. Material and methods
The reference network has used in 1980s for researches of the Anapa bay-bar coast line dynamics [11]. In the late 1980s monitoring has been stopped, the reference network has gradually disintegrated. The long-term trend of coast development isn’t detected for rather small term of monitoring as size of the short-period changes of coast configuration considerably exceeded long-term changes.
Subsequently, long-period changes in the coastal line were determined on the basis of materials obtained by the aerial survey in 1948, 1972, 1992, and 2000 [12]. The parameters of the main morphological elements of the bay-bar were measured manually using reference lines in images. When analyzing these data, the authors noted the prevalence of erosion over accumulation along the shore [12] (Fig. 2). In the period 1992–2000, on the northern part of the also established that the northern part of the bay-bar was stable or even increased in the width of its beach. It should be noted that the values cited in [12] are of a low accuracy and reliability. This is partly explained by the deficiency of primary materials (data of some survey sessions cover only some areas of the bay-bar) and partly by the shortcomings of the methods used to interpret aerial images and measure the quantitative parameters. The main shortcomings of these investigations consisted in the absence of data on the exact geographic position of objects, difficulties related to the establishment of boundaries between morphological elements, and an insufficient number of measurement lines.
The appearance of previously unavailable sounding data on the Internet and the development of technologies for their processing offered an opportunity to specify and refine the dynamics of changes in the seashore line of the bay-bar. The authors of [8] were the first to investigate the long-period dynamics of the shore of the Anapa bay-bar by analyzing aerial images obtained during World War II. Subsequently, using these materials and CORONA satellite images obtained on for August 12, and GeoEye images from August 3, 2011, Lavrent’ev [13] measured the displacement of the seashore with a step of 1 km. The images were processed using advanced software; corresponding materials have been incorporated into the GIS using Scanex WEB GeoMixer technology [13]. The data in [8, 13] (Fig. 2) significantly differ from the values in [12]; nevertheless, they made it possible to estimate seashore dynamics for the southern segment of the bay-bar, approximately 10 km in length. Definition of long-term coastal dynamics for all Anapa bay-bar water edge and increase of received result reliability is goal of presented researcher.
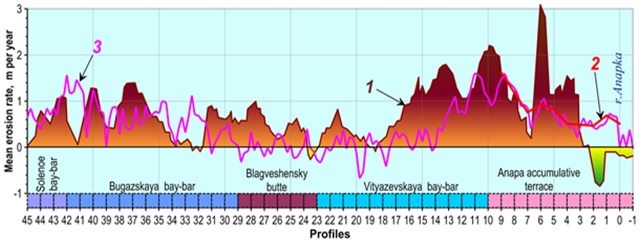
Fig. 2. Erosion rates on the seashore of the Anapa bay-bar: 1 (color) after [12] surveying sessions of 1948, 1972, 1992, and 2000; 2- after [14] (surveying sessions of 1966 and 2011; 3-new data (modified from [10]).
In this work, materials of an aerial photography 1941-44s (carried out by the German air forces during World War II [15] (table 1)), satellite images are made by CORONA program [16] in 1960-1970s (table 2). The satellite images with a spatial resolution of 0.5–2.0 m obtained since 2003 were used for fixing of archival photograph and analysis of possible short-period water edge dynamics influence.
Table 1. The data on the Luftwaffe aerial photos used in the research [8]
|
Image code |
Survey data |
Approximate scale |
|
DT/TM5 - Nr. 185 |
24.10.1941. |
1:43000 |
|
DT/TM5 - Nr. 199 |
17.11.1941. |
1:25000 |
|
DT/TM5 - Nr. 203 |
09.01.1944 |
1:9700 |
Table 2. The data on the CORONA satellite images used in the research [14]
|
Data Set Attribute |
Attribute Value |
|||||||
|
Entity ID |
DS1009-2056DF111 |
DS1009-2056DF112 |
DS1022-1056DA136 |
DS1036-2187DA111 |
DS1036-2187DA112 |
DS1103-2106DA084 |
DS1114-2122DF094 |
DS1114-2122DA100 |
|
Acquisition Date |
1964/09/09 |
1964/09/09 |
1965/07/23 |
1966/08/21 |
1966/08/21 |
1968/05/08 |
1971/04/01 |
1971/04/01 |
|
Mission |
1009-2 |
1009-2 |
1022-1 |
1036-2 |
1036-2 |
1103-2 |
1114-2 |
1114-2 |
|
Frame |
111 |
112 |
136 |
111 |
112 |
84 |
94 |
100 |
|
Part |
d |
d |
a |
c |
c |
d |
d |
a |
|
Direction Flag |
056D |
056D |
056D |
187D |
187D |
106D |
122D |
122D |
|
Image Type |
BW |
|||||||
|
Camera Type |
Forward |
Forward |
Aft |
Aft |
Aft |
Aft |
Forward |
Aft |
|
Camera Resolution |
Stereo Medium |
Stereo Medium |
Stereo Medium |
Stereo Medium |
Stereo Medium |
Stereo High |
Stereo High |
Stereo High |
|
Film Type |
High Resolution Scanned 70mm Panoramic |
|||||||
|
Generation |
2 |
|||||||
|
Polarity |
Negative |
|||||||
The geometrical model of the sensor and the results of it calibration aren’t available for the most satellite images. Camera model parameters aren’t absent for CORONA satellite images and aerial photography 1941-44s. The development of many cartographic services (Google Earth, Yandex Maps, Nokia, Bing Maps, Kosmosnimki.ru, etc.) these have appeared in the current decade have made it possible to use a large database of satellite images in scientific investigations. In this respect, the Google Earth service, which allows satellite images obtained at different times to be used, is particularly convenient. The availability of series of images with temporal gaps between them lasting from several weeks to several months provided an opportunity for the substantial revision of views on the rates and mechanisms of changes in the water edge.
The geometrical correction of raster patterns and obtained from satellite images data vector was realized by OziExplorer, Scanex Image Processor, ERDAS programs. The main difficulty in the spatial referencing was a small number of visually determined reference points, simultaneously recognizable in historical and recent images. We used the buildings, linear objects (roads), topographic forms that remained up to the present time (Fig. 3-5). Another difficulty was the configuration of the bay-bar, which did not allow us to locate uniformly the reference points within the images (large sea basins and firths completely cover the opposite diagonal angles of the image).
.jpg)
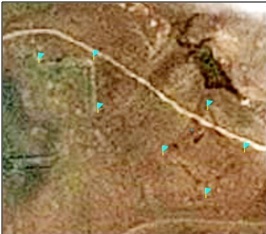
Fig. 3. Application of the elements of the old fortifications as the reference points: the left image is related to 1965 and the right image was taken in 2013 [17].
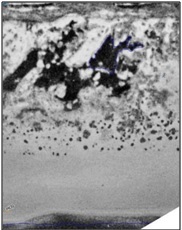
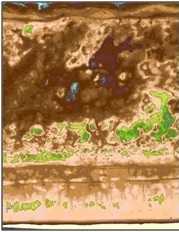
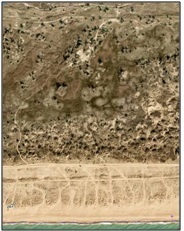
Fig. 4. Application of the elements of terrain topography as the reference points (they are seen on the digital model but hardly readable in the optical range): the photo on the left was made in 1966. A digital model of terrain topography (DMTT) is in the middle; and an orthophotoplan map of 2013 in on the right [17].
.jpg)
.jpg)
.jpg)
Fig. 5. Validation of the quality of spatial referencing of the images using reference points (denoted with pink color): from left to right 1941, 1965, and 2013 [17].
Depending on the number of reference points, the transformation of the raster or vector was made according to a polynomial model of the second or third degree. A mosaic of aerial photo map images of November 21, 2013 with a space resolution of 10 cm was taken as the basic image. It was superimposed on a high-resolution digital model of terrain topography (DMTT) obtained from the data of aerial laser scanning (ALS) [18].
As a result planimetric deviations of the used pictures for all bay-bar water edge are minimized. After the final spatial referencing of the images and vector data we collected the quantitative information on the dynamics of the water edge. It was already mentioned that strictly fixed terrain landmarks are lacking; therefore, it was necessary to form a reference basis, from which the distance to the water edge could be calculated. A virtual basic polyline was used as such a basis, which spatially repeated the contour line of the bay-bar. The measuring of the distance from the basic line to the water edge was performed along the normal that crosses the standard reference point (with a distance interval of 1 km) and additional lines with a step of 0.25 km. The further processing and visualization of the data was performed using the Microsoft Excel 2007; Golden Software (Grapher and Surfer) programming packages.
The estimated accuracy of the spatial referencing is within 5 m for image after 2003, within 10 m for images obtained in 1941-1944s and 1964-1988s.
Figure 6 demonstrates substantial variations in the water edge position according to surveying sessions performed during a relatively short period (5-10 years). Its real variability may be even more significant. In this connection, a comparison between data obtained by two one-time surveying sessions may yield significant distortions of the real dynamics (when areas with brief erosion - accumulation periods are intersected or superposed). In the ideal situation, where the shoreline is smoothed along the entire bay-bar, a single image may be used. In other situations characterized by more or less expressed erosion-accumulation “waves,” data on the position of the water edge should be averaged for some period or for a particular area of the bay-bar to compensate for this distortion.
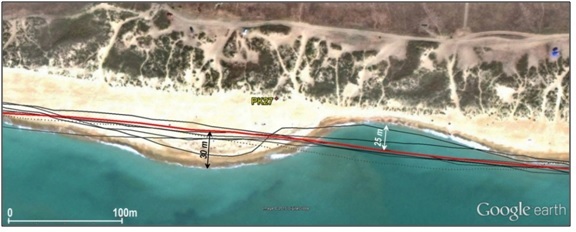
Fig. 6. Variations in the location of water edge line in the region of profile 27 (based on the data of surveys in 2007-2015) (modified from [10]).
In order to assess probable measurement error related to the configuration of the shore of the bay-bar and defined linear parameters of the along-shore erosion-accumulation “wave,” the distances between the latter and the baseline were measured with a step of 100 and 250 m along profiles 22-24 (Fig. 6). The comparison of these measurement data with each other demonstrates that the averaging of the water edge positions carried out with different steps yields a difference of 0.5-3.7 m, which is minimal for the most smoothed shoreline (table 3). Thus, the error in determining the average position of the water edge related to variability in its configuration amounts to several meters (i.e., is close to the measured annual changes), although it may be diminished by the higher density of the surveying profiles.
Table 3. Average distance between the water edge and base line (m) [10].
|
Averaging step, m |
Averaging area (profile = km) |
August 12, 2011 |
September 13, 2011 |
December 12, 2012 |
|
250 |
22-24 |
192.3 |
194.2 |
196.9 |
|
100 |
22-24 |
196.0 |
196.6 |
197.4 |
|
250 |
20-30 |
162.3 |
163.1 |
166.3 |
III. Long-term dynamics of the water edge
The analysis of data obtained by remote sounding and natural observation reveals that, depending on the current and the preceding hydro-lithodynamics situation, the configuration of the shoreline in the same area of the bay-bar may change from practically rectilinear to sinusoid, and one-time measurements along particular profiles may yield significant deviations from average position. Therefore, the data of short-period dynamics of the water edge were studied before the analysis of new data on the long-term dynamics of the shoreline. For this purpose, images with a time gap of several days to one year were used.
Many images demonstrate alternating areas of local erosion or accumulation (Fig. 6). The length of the “wave” reflecting the erosion–accumulation ratios varies from 350 to 500 m. In neighboring erosion-accumulation areas, the deviation of the water edge from its “average” position amounts to 20-30 m (Fig. 6).
The migration of the water edge with non-permanent nature may not necessarily be accompanied by the formation of areas of erosion-accumulation. The displacement of the water edge in different directions over large shoreline distances results from sea-level fluctuations. According to data on the sea level changes at the Anapa hydrometeorological station obtained for the period of 1977-2006 [14], the amplitude of fluctuation is up to ±0.4 m. On some sites the difference between absolute heights of ridges of the coastal submarine bar and the water edge of the beach isn’t exceed 0.5 m. Correspondingly, significant displacement of the water edge is marked because of the sea level changes. No real erosion or accumulation is observable in such situations.
As follows from the above-mentioned data, the analysis of long-term changes in the position of the water edge should take into consideration the configuration of the shoreline at each surveying session. The superposition of images obtained on July 23, 1965 and August 21, 1966 reveals that the difference between the positions of the water edge along individual profiles exceeds 20 m. The average displacement of the water edge during 13 months was only 0.8 m (toward erosion), i.e., it is within the limits of measurement error. Such values of change in the water edge position have also been documented by one-time surveying sessions in the period of 2011–2015, when the difference between the average annual position of the shoreline amounted to 3 m (both landward and seaward displacements were recorded). Such values may be explained either by sea level fluctuations or measurement error and cannot serve as an unambiguous indication of erosion or accumulation. As a whole, 2011 and 2013 were characterized by a general retreat of the shore (and significantly indented patterns), while 2012, 2014, and the initial part of 2015 were marked by its advance (and a smoothed shoreline).
Comparison of the data obtained by a onetime survey on August 21, 1966 and November 21, 2013 revealed that most of the bay-bar was subject to erosion (locally exceeding 70 m), although accumulation also developed (over 20 m). The landward displacement of the water edge for the entire area averaged over 47 years is estimated to be 23.3 m.
For compensation of short-term variability and result specification, we averaged data on the position of the water edge in the periods of 1964–1966 (three surveying sessions) and 2012–2015 (seven surveying sessions). The displacement of the water edge along the entire bay-bar averaged over approximately 50 years was 22.1 m (landward), while the maximum erosion value exceeded 80 m (Fig. 7). This value is obviously beyond the limits of probable errors; therefore, we may speak about the retreat of the shore on the Anapa bay-bar.
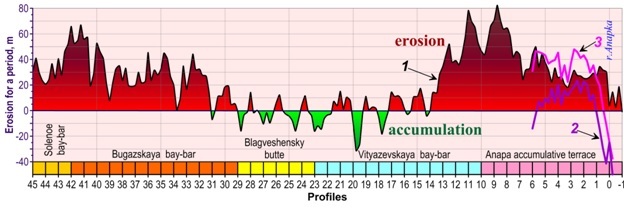
Fig. 7. Dynamics of the Anapa bay-bar water edge for the period of over 50 years:
1 - between average of 1964-66 и average 2011-15 (modified from [10]); 2 – between 1941 and average of 1964-66; 3 - between 1941 and average of 2011-15.
Figure 7 clearly demonstrates the presence of areas in the Anapa bay-bar that differ significantly from each other by the mode of erosion-accumulation. For example, areas with strong erosion (northern and southern between profiles 31-45 and 0-13, respectively) are definable. The central part of the bay-bar (between profiles 14-31), with alternating areas characterized by erosion and accumulation of comparable intensity may be considered relatively stable. The average shift of the water edge for the entire area is 0.2 m (landward), which is comparable with the error limit.
The aerial images 1941-1944 (covers only 6 km of the southernmost part of the bay-bar) provide important information on probable changes in the coastal dynamics. The high accumulation values south of the present-day mouth of the Anapka River in the period of 1941-1966 are probably explained by the technogenic northward displacement of the latter at the beginning of the 1960s. In the period of 1966-2013, this area was marked by insignificant erosion despite artificial sand filling.
IV. Conclusions
The comparison between recent and historical data reveals that the shoreline in most of the bay-bar is retreating. The rate of coast retreat is significantly different at different coastal sections, ranging from 0 m/year to 1.6 m/year. Also it is noted that the stability or erosion periods don't coincide at the different sections.
In order to answer the question, as to what are the factors responsible for such a strong differentiation of the seashore in the Anapa bay-bar with respect of its erosion-accumulation mode, special investigations are needed with consideration of the data on the long-term hydrodynamic regime of the sea, influence of eolian processes, and many others. The following probable explanations may be preliminarily suggested:
- the “contrasting” wave regime: strong storms with a dominant along-shore component (with different directions in the opposite ends of the arch-shaped bay-bar); these result in the erosion of the northwestern and southeastern parts of the bay-bar and migration of drifts toward its central (stable) segment;
- the erosion of the northwestern part of the bay-bar may represent an element of the evolution of the abrasion-accumulation system (retreat of a marine-accumulation body together with the retreat of the abrasion bedrock shore of the Taman Peninsula);
- the erosion of the southernmost part of the Anapa bay-bar may be determined by the deficiency of beach-forming sediments, which are absent in its northwestern part (since the along-shore flow of sedimentary material is blocked or exhausted in the central part of the bay-bar, keeping it stable);
- the erosion of the southern end of the Anapa bay-bar may be explained by the unidirectional removal of sand from the beach and its subsequent accumulation in eolian structures (this processes is strengthened after the planting of greenery and consolidation of the dune belt within the Anapa resort in the 1960s-1970s);
- the coast retreat in the southern Anapa bay-bar may be determined by anthropogenic changes in beach topography (lowering of altitudes);
- the stable section in the central part of the bay-bar may be the result of the shadowing effect of the Mary Magdalene bank. This bank significantly reduces wave impact on the coast.
Thus the new data has made it possible to specify and refine the dynamics of the sea shoreline throughout the entire Anapa bay-bar. These observations are of importance for the study of the basic aspects of the lithodynamic processes in the coastal zone and the development of models for predicting the further evolution of the geosystem of the bay-bar in order to solve practical social-economic tasks.
V. Acknowledgments
The in-situ investigations and cameral treatment of material were supported by the Russian Science Foundation (project no. 14-1700547). The analysis of published and archive data were supported by the Russian Foundation for Basic Research (project no. 15-05-02654). This work became possible owing to remote sounding materials available in different state and private organizations in many countries, which are of free access on the Internet.
1. R.D. Kosyan, V.V. Krylenko, “Modern status of marine accumulative shores of Krasnodar krai and their use”, Nauchnyi Mir, Moscow, 2014, [in Russian].
2. V.P. Zenkovich, “The Coasts of the Black and Azov Seas“, Izd. Geogr. Liter., Moscow, 1958 [in Russian].
3. Ya.A. Izmailov, “Evolutionary Geography of the Shore Zones of the Azov and Black Seas“, Book 1: Anapa Bay Bar, Lazarevskaya Poligrafiya, Sochi, 2005 [in Russian].
4. V.N. Mikhailov, D.V. Magritskii, and A.A. Ivanov, “Hydrology of Delta and Estuarine Marine Region in Kuban“, GEOS, Moscow, 2010 [in Russian].
5. R.D. Kosyan, S.B. Kuklev, V.V. Krylenko, “Fragile equilibrium of the Anapa Bay Bar“, Priroda, Moscow, 2012, № 2, pp. 19-28 [in Russian].
6. V.V. Krylenko, R.D. Kosyan, and A.D. Kochergin, “Regularities of the formation of the grain-size composition of the bottom and beach sediments of the Anapa Bay-Bar, Oceanology, Engl. Transl., 2011, 51 (6), 1061-1071.
7. V.V. Krylenko, M.V. Krylenko, “Analysis of significance and relationship of natural factors of formation of granulometric composition of sediments and relief of accumulative shore forms of the Black Sea“, Regional Geological Policy and Ecological Dynamics, Vernadsky National University, Simferopol, 2014, Vol. 10, No. 1, pp. 669-675 [in Russian].
8. V.V. Krylenko, M.V. Krylenko, “Retrospective analysis of cartographic and visual material as the tool for assessment of natural objects“, Geosystems: Factors of Development, Rational Use, and Control Methods, Yug, Krasnodar, 2011,), pp. 294-296 [in Russian].
9. R.D. Kosyan, Yu.N. Goryachkin, V.V. Krylenko, et al., “Crimea and Caucasus accumulative coasts dynamics estimation using satellite pictures“, Turk. J. Fish. Aquat. Sci. 2012, 12, 385-390.
10. V.V. Krylenko, “Seashore Dynamics of the Anapa Bay-Bar”, Oceanology, 2015, Vol. 55, No. 5, pp. 742-749.
11. Ya.A. Izmailov, “Brief characteristics of the geological, morphological, existing System of lithologic monitoring of Sevkavgeologiya Company in the shore zone of the Azov and Black Seas in Krasnodar Krai“, Sochi, 1991 [in Russian].
12. Ya.A. Izmailov, M.Ya. Izmailov, L.A. Sidorenko, “A final report on the analysis of dynamics of the sand body of the Anapa beach“, Kuban’geologiya, Laza- revskoe, 2005 [in Russian]
13. N.V. Lavrent’ev, S.B. Kuklev, “Analysis of changes of the shore line of Anapa Bay Bar over last 70 years using remote survey data“, Zemlya iz Kosmosa - Naibolee Eff. Resheniya, No. 13, 38-41 (2012).
14. Climate of the Russian Seas and the Key Regions of the World Ocean: Digital Atlas, Join Informational System on the World Ocean (ESIMO), Obninsk, 2007,) [in Russian]. http://www.esimo.ru/atlas/Black/2_waterlevel_ station_98062_3.html
15. WWII Aerial Photos and Maps (Series: Aerial Photographs). http://www.wwii-photos-maps.com
16. U.S. Department of the Interior U.S. Geological Survey (USGS). http://earthexplorer.usgs.gov
17. M. Krylenko, R. Kosyan, V. Krylenko, “Accumulative coast dynamics estimation by satellite camera records“, Third international conference on remote sensing and geoinformation of the environment (RSCY2015) Book Series: Proceedings of SPIE. Vol. 9535. Hadjimitsis, DG; Themistocleous, K; Michaelides, S; et al, 2015. P. 95351K.
18. E. Boyko, V. Krylenko, M. Krylenko, “LIDAR and airphoto technology in the study of the Black Sea accumulative coasts“, Third international conference on remote sensing and geoinformation of the environment (RSCY2015), Book Series: Proceedings of SPIE. Vol. 9535. Hadjimitsis, DG; Themistocleous, K; Michaelides, S; et al, 2015. P. 95351Q.