


Russian Federation
BISAC NAT010000 Ecology
BISAC NAT045050 Ecosystems & Habitats / Coastal Regions & Shorelines
BISAC NAT025000 Ecosystems & Habitats / Oceans & Seas
BISAC NAT045030 Ecosystems & Habitats / Polar Regions
BISAC SCI081000 Earth Sciences / Hydrology
BISAC SCI092000 Global Warming & Climate Change
BISAC SCI020000 Life Sciences / Ecology
BISAC SCI039000 Life Sciences / Marine Biology
BISAC SOC053000 Regional Studies
BISAC TEC060000 Marine & Naval
The Anapa bay-bar is located in the northwestern part of the Black Sea. With the goal in mind to determine the short-term dynamics of the Anapa bay-bar we analyzed satellite images from 2003 to the present. Depending on the hydro-lithodynamical situation the shoreline configuration during storm can vary from a rectilinear to sinusoidal forms. There are regions of local erosion or accumulation whose formation is related to the alongshore motion of sediments and dynamics of underwater bars. Comparison of the data on 1965 and 1966 showed that in this period the amplitude of the shoreline position was more than 20 m but average displacement of the shoreline for 13 months was only 0.8 m. This study showed that for the analysis of changes in the shoreline position is necessary to consider the configuration of the coastline at the time of each observation and the local dynamics.
coastal dynamics, remote sensing, Anapa bay-bar, accumulation.
I. Introduction
The Anapa bay-bar is situated in the northwestern part of the Caucasian Black Sea coast (see paper “Analysis of long-term dynamics of the Anapa bay-bar water edge” in this Proceeding, Fig. 1). The length of the Anapa bay-bar is about 47 km. The width varies from 80 m to 1.5 km in its northern and southern parts, respectively. The beaches largely composed by quartz sand with an admixture of shells and detritus have width to 150 m. The Anapa bay-bar is formed by sediment migrating in transverse and longitudinal directions [1, 2, 3, 4]. The entire bay-bar and especially its southern part are intensely used in recreation (Fig.1).
.jpg)
Fig. 1. Typical view of the Anapa resort.
In spite of intense economic (recreation) use [5] the hydro-technic and other constructions breaking natural sediment movements are absent throughout bay-bar. The Anapa bay-bar accumulative coast dynamics is favorable object for the investigation of natural processes and their regularities in condition changing environmental. Besides accurate data on the sea coast dynamics are needed for planning economic activity in its limits and protection of this bay-bar. Presented researches are dedicated to the study of the spatial and temporary features of the Anapa bay-bar development and to improvement of remote monitoring methods of shoreline short-term dynamics.
II. Material and methods
The analysis of annual survey data obtained along the reference network deployed by the North Caucasus Geological Center in 1984 [2] revealed that significant changes in the width of the beach (±20 m in a year) are observable at any area of the bay-bar. In addition, it has been established that variations in the spatial position of the water edge along the seashore are sinusoidal with a “wave length” of approximately 2.0-2.5 km. These “waves” are displaced in a direction parallel to the sediment transport.
In view of labor input and lack of financing the monitoring of dynamics of the coast has been stopped in the late 1980s. The reference points network has been destroyed therefore renewal of natural measurements by standard methodic was impossible.
Development of new remote sensing technologies has made possible to refuse almost completely from natural measurements of some parameters of the coastal relief.
The cartographic services development (Google Earth, Yandex Maps, Nokia, Bing Maps, Kosmosnimki.ru, etc. [6]) that have appeared in the last decades have made it possible to use a large database of satellite images in scientific investigations. In this respect, the Google Earth service, which allows satellite images obtained at different times to be used, is particularly convenient. A total of approximately 40 satellite images of the different parts of the Anapa bay-bar were found from 2003 to the present time. The series of images with a time difference between the imaging from a few weeks to a few months allowed us to change significantly our concepts about the velocities and direction of the changes in the location of water edge.
In this work, materials of an aerial photography 1941-1944 (carried out by the German air forces during World War II [7]), satellite images 1960-1970s (carried out by CORONA program [4]), and satellite images with a spatial resolution of 0.5–2.0 m obtained since 2003 were used in this paper for short-time coastal dynamics of the Anapa bay-bar study.
Inasmuch as techniques of obtaining and the quality of spatial referencing are unknown, images were subjected to geometric correction. We performed the further processing of rasters and vector data from the satellite images by means of the Scanex Image Processor programming package. A mosaic of aerial photoimages obtained on November 21, 2013 with a spatial resolution of 10 cm superposed on a high-precision digital model of the relief (DMR), which was constructed on the basis of data yielded by aerial laser scanning (ALS), served as a base image. As a result plan distortions of the images used are minimal for the entire coastal zone of the bay-bar.
The obtainment of the numerical information about the water edge dynamics was produced by own methods. Beginning from 2010, researchers at the Southern Branch of the Institute of Oceanology have been conducting complex investigations of the Anapa bay-bar [8, 9, 10]. The goal of their work is researching of the dynamics of the bay-bar topography and estimation of its stability related to the variations in the external conditions. For the systematization and spatial binding of these data “virtual” (since no permanent reference marks are available on the bay-bar) reference points are used, located near the average position of the water edge at distances of 1 km (see paper “Analysis of long-term dynamics of the Anapa bay-bar water edge” in this Proceeding, Fig. 1). Coordinates of these “virtual” points are brought into the database and are used constantly. These points are crossed by reference profiles extending transversely to the shoreline; along these profiles, various data are gathered. For the study of the dynamics of the water edge, a basis was constructed, providing an opportunity to measure distance between the latter and the water edge. The virtual base polyline repeating in plan the shapes of the bay-bar was used as a basis. The distance between the base line and the water edge was measured along the normal drawn via a standard reference point (every 1 km) and additional points located 0.25 km away from each other. The further processing and visualization of the data was performed using the Microsoft Excel 2007; Golden Software (“Grapher” and “Surfer”) programming packages.
III. Short- term dynamics of the water edge
As shown long-term observations and the analysis of data of remote sensing, the configuration of the bay-bar coastline is very changeable now. Also considerable changes of a water edge configuration are noticeable between separate surveys on aerial photographs in 1941-1944 and on space pictures in 1960-1980s. There are periods when the coastal line on all length of the bay-bar is leveled and its outline approaches to a concave arch. The existence of the coastline curves on separate sites of bay-bar is most typical.
Space and aerial photographs of the period 2003-2015 (time interval between images from several days to one year) are used for determination of water edge spatial position change and speed of this process. It is noted that depending on the hydro-lithodynamic situation, the configuration of the shoreline can vary practically from a rectilinear to sinusoidal forms (Fig. 2).
North of Profile 14 in the northern and central parts of the bay-bar, the length of the “wave” reflecting the erosion–accumulation ratios varies from 350 to 1000 m (less often 150-200 m for example in 1965). These sizes it is much less specified in [2] 2.0-2.5 km that indicates considerable variability of erosion-accumulative “wave” form and size that is visible on images of 1966 and 1988. In neighboring erosion-accumulation areas, the deviation of the water edge from its “average” position amounts to 20-30 m (Fig. 3). Forelands formed by storms are usually characterized in plan by asymmetrical (drop-shaped) outlines with a steeper shore bend on the leeward side. Areas with forelands are marked by a conjunction between the coastal submarine bar and the shore, while in the erosion area they are separated from each other. The forelands become gradually smoothed, which results in the simultaneous smoothing of the shoreline. This smoothing process provides an impression that forelands “advance” toward the dominant sediment flow. Nevertheless, Fig. 3 shows that the “lee” edge migrates along the shore for tens of meters, gradually filling an erosion micro bay. The total rate of shoreline smoothing depends to a significant extent on the current hydrodynamic situation; the whole process lasts from several months to a year. The table 1 presents data on the distance between the water edge and the base line averaged for areas between profiles (including the area shown in Fig. 3). It is seen that the smoothing of the water edge is accompanied by a gradual seaward migration of the shore. During the period of maximum rates of shoreline smoothing, the entire system of submarine bars extends parallel to the water edge; practically no gaps or bridges exist between neighboring bars.
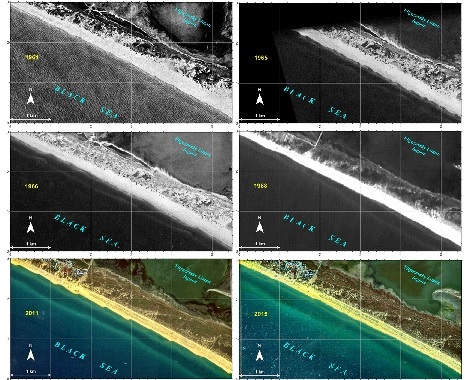
Fig. 2. Variations in the shoreline configuration of the Anapa bay-bar central part (prof. 20-25).
The erosion-accumulation areas are also observable south of Profile 14, where their contours are however almost symmetrical (Fig. 4) and the wavelength rarely exceed 250 m. As in the northern part of the bay-bar, the shore forelands join usually submarine bars; at the same time, areas of erosion correspond to a gap in the coastal submarine bar, not a bend. It is conceivable that the formation of shore configuration in this part of the bay-bar is influenced to a significant extent by discontinuous currents.
Man-made changes of the coastline configuration on all length of Anapa bay-bar are practically absent. There are the river run-off regulation and beach nourishment by imported sand for recreational ensuring to the south of the present-day mouth of the Anapka River. Near 33th profile the clearing of the artificial channel through the bay-bar accumulative body for ensuring of water exchange and fish migration between Black Sea and Kiziltash liman is realized annually.
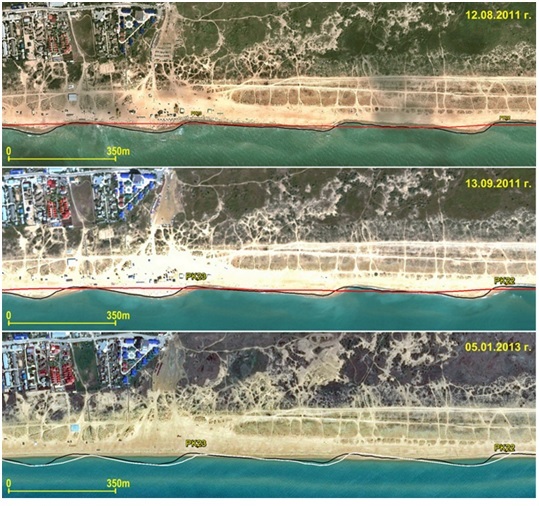
Fig. 3. Short-term variations in the configuration of the shoreline in the area of profiles 22 and 23 (lines designate water edge positions: (black) August 12, 2011, (white) September 13, 2011, (red) January 5, 2013) (modified from [11]).
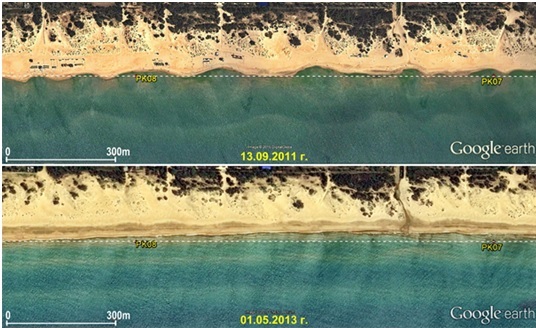
Fig. 4. Short-term variations in the shoreline configuration in the area of profiles 7-8 (modified from [11]).
IV. Interrelation between short-term water edge dynamics and long-term changes
The superposition of images obtained on July 23, 1965 and August 21, 1966 reveals that the difference between the positions of the water edge along individual profiles exceeds 20 m. The average displacement of the water edge during 13 months was only 0.8 m (toward erosion), i.e., it is within the limits of measurement error. Such values of change in the water edge position have also been documented by one-time surveying sessions in the period of 2011–2015, when the difference between the average annual position of the shoreline amounted to 3 m (both landward and seaward displacements were recorded). As a whole, 2011 and 2013 were characterized by a general retreat of the shore and significantly shoreline irregularity, while 2012, 2014, and the initial part of 2015 were marked by its advance and a smoothed shoreline. Such values may be explained either by sea level fluctuations or measurement error and cannot serve as an unambiguous indication of erosion or accumulation.
For the spatial features assessment of intensity of the short-term variations in the water edge position the standard deviation of the data obtained during the period of 2011–2015 (9 surveying sessions) was determined. Figure 5 presents a plot illustrating the absolute values of the standard deviation and their average values. Using values of the potential deviation of the current position of the water edge from its average position, we may mark several typical sections of the bay-bar. Sites with high intensity and amplitude of water edge position changes (strong washout: northern – between profiles 36-40 and central – between profiles 21-26) can be allocated. It is obvious that the boundaries of these areas are inconsistent with the boundaries of areas with different rates of long-term shoreline retreat (Fig. 4).
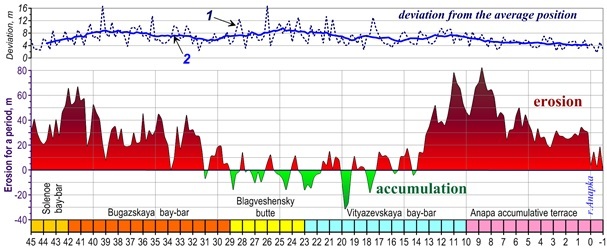
Fig. 5. Dynamics of the Anapa bay-bar shore for a period of approximately 50 years (according to surveying sessions in 1964–1966 and 2012–2015) and values of water edge deviation from its average position for the period of 2011–2015. Numeric designations: (1) absolute deviation value, (2) averaged deviation value (modified from [11]).
V. Conclusions
Thus, our researches have shown that sea coast of Anapa bay-bar is characterized by the considerable variability of the planned water edge position along the whole length. At most the alternating areas of local erosion or accumulation are marked their size and shape considerably vary in placement and time. Most frequently such a configuration is observed in the central part of the bay-bar. Such a configuration is not appears after any storm. Comparison of water edge dynamics and parameters of the wave energy vector in July-September 2013 has shown that for the strong change of the water edge configuration doesn't require a severe storm. During this period the moderate sea with dominant western component were observed. Probably a significant along-shore component of wave activity is necessary for "curvature" of the coast line. It is possible (this problem requires additional investigation) that formation of the coastal ledges is connected with the alongshore sediment movement and dynamics of the underwater bars.
Differentiation of the Anapa bay-bar coast on features of the water edge short-term dynamics can be caused by:
- deformation of off-lying sea waves under the influence of an underwater relief and capes, thereat wave parameters differ on adjacent coastal sections;
- transformation of the underwater bars under influence of the coastal wave currents;
- simultaneous receipt of the large sand volumes to some coastal sections, for example, during washout of the original coast or a dune, man-made activity;
- wave shadow сreated by Mary Magdalene's bank and " mobilization" of the accumulated deposits during most severe storms.
VI. Acknowledgments
This work became possible owing to remote sounding materials available in different state and private organizations in many countries, which are of free access on the Internet. The cameral treatment of materials, sampling, and analysis of published and archive data were supported by the Russian Science Foundation (project 14-1700547). The data geodetic binding were supported by the Russian Foundation for Basic Research (project 15-05-02654).
1. V.P. Zenkovich, “The coasts of the Black and Azov Seas”, Izd. Geogr. Liter., Moscow, 1958 [in Russian].
2. Ya.A. Izmailov, “Evolutionary geography of the shore zones of the Azov and Black Seas”, Book 1: Anapa Bay Bar, Lazarevskaya Poligrafiya, Sochi, 2005, [in Russian].
3. R.D. Kosyan, S. B. Kuklev, and V. V. Krylenko, “Fragile equilibrium of the Anapa Bay Bar”, Priroda, Moscow, 2012, No. 2, 19-28 [in Russian].
4. U.S. Department of the Interior U.S. Geological Survey (USGS). http://earthexplorer.usgs.gov
5. R.D. Kosyan and V.V. Krylenko, “Modern status of marine accumulative shores of Krasnodar region and their use”, Nauchnyi Mir, Moscow, 2014 [in Russian].
6. M. Krylenko, R. Kosyan, V. Krylenko, “Accumulative coast dynamics estimation by satellite camera records“, Third international conference on remote sensing and geoinformation of the environment (RSCY2015) Book Series: Proceedings of SPIE. Vol. 9535. Hadjimitsis, DG; Themistocleous, K; Michaelides, S; et al, 2015. P. 95351K
7. WWII Aerial Photos and Maps (Series: Aerial Photographs). http://www.wwii-photos-maps.com
8. V.V. Krylenko and M.V. Krylenko, “Analysis of significance and relationship of natural factors of formation of granulometric composition of sediments and relief of accumulative shore forms of the Black Sea”, Regional Geological Policy and Ecological Dynamics, Vernadsky National University, Simferopol, 2014, Vol. 10, No. 1, pp. 669-675 [in Russian].
9. V.V. Krylenko and M.V. Krylenko, “Retrospective analysis of cartographic and visual material as the tool for assessment of natural objects”, Geosystems: Factors of Development, Rational Use, and Control Methods, Yug, Krasnodar, 2011, pp. 294-296 [in Russian].
10. V.V. Krylenko, R.D. Kosyan, and A.D. Kochergin, “Regularities of the formation of the grain-size composition of the bottom and beach sediments of the Anapa Bay-Bar”, Oceanology, 2011, 51 (6), pp. 1061- 1071.
11. V.V. Krylenko, “Seashore Dynamics of the Anapa Bay-Bar”, Oceanology, 2015, Vol. 55, No. 5, pp. 742-749.