


BISAC NAT010000 Ecology
BISAC NAT045050 Ecosystems & Habitats / Coastal Regions & Shorelines
BISAC NAT025000 Ecosystems & Habitats / Oceans & Seas
BISAC NAT045030 Ecosystems & Habitats / Polar Regions
BISAC SCI081000 Earth Sciences / Hydrology
BISAC SCI092000 Global Warming & Climate Change
BISAC SCI020000 Life Sciences / Ecology
BISAC SCI039000 Life Sciences / Marine Biology
BISAC SOC053000 Regional Studies
BISAC TEC060000 Marine & Naval
New approach of assessment of coastal zone vulnerability to wave action, based on nonlinear properties of wave transformation, is presented on example of Anapa bay-bar coasts.
wave transformation, relief deformation, coastal zone.
I. ABSTRACT
While approaching the coastline, waves reach intermediate depth where they transform due to shoaling and nonlinear near-resonant triad interactions between wave components. The last process causes periodical in space variations of wave symmetry that leads to occurrence of cross-shore sediment transport gradients, that results in corresponding relief changes. In this paper method of coastal zone classification depending on its vulnerability to wave impact is developed based on analysis of nonlinear wave transformation effects. Mean bottom slope, sediment size and density, and wave height and period are the main parameters that allow predicting whether coastal zone will be stable or the erosion will occur. The method is based on assessment of balance between onshore component of sediment transport caused by wave asymmetry and offshore component driven by undertow. This approach was applied to the Anapa coasts.
II. INTRODUCTION
Problem of influence of nonlinear waves and undertow on sediment transport is not new. For example, Abreu with colleagues [1] developed new bed shear stress predictor based on index of skewness and waveform parameter that characterize wave skewness and asymmetry. If incorporated in formula for sediment transport rate this predictor provides better prediction of sediment transport in laboratory experiments than original method of Nielsen. But in their work process of periodic in space changes of asymmetry due to energy exchange between wave harmonics is not considered. This work, on the other hand, is focused on manifestations of triad interactions in cross-shore sediment transport patterns.
In this work coastal zones with mild and sandy bottom slopes are studied. Such coasts are characterized by presence of sandbars, which indicates realization of scenarios of wave transformation with periodic exchange of energy between wave harmonics due to near-resonant triad interactions, as was shown in [2]. Such scenarios are realized when relatively steep waves propagate above mild bottom slope and can be separated from scenarios with small amplitudes of second harmonics using Iribarren number (
III. METHOD DESCRIPTION
To calculate cross-shore sediment transport caused by waves Bailard's formula based on Bagnold's energetic approach was used
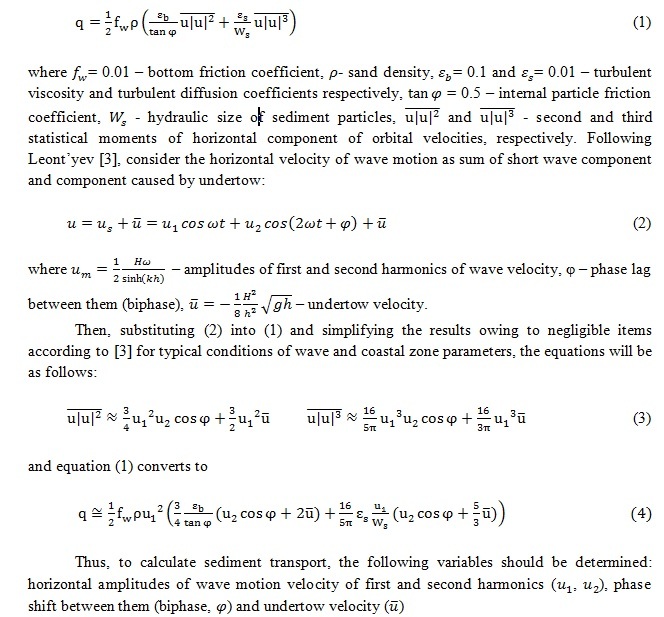
Thus, to calculate sediment transport, the following variables should be determined: horizontal amplitudes of wave motion velocity of first and second harmonics ( ,
,  ), phase shift between them (biphase,
  ) and undertow velocity (
 )
)
When reaching intermediate depth, waves start to transform due to near-resonant triad interactions that manifest in growth of higher wave harmonics. Typical for mild sloping beaches wave regimes produce scenarios of wave transformation that are characterized by periodical spatial exchange of energy between first and higher harmonics of wave motion. This process is accompanied with corresponding changes of biphase and determines spatial structure of onshore component of sediment transport that is caused by asymmetry of waves, as well as offshore component provided by undertow. As was shown in [4], when second harmonic starts to grow, biphase is negative and approximately equals –pi/2, when second harmonic reaches its maximum, biphase equals zero, and when it decreases, biphase becomes positive and tends to pi/2 (Fig. 1).

Fig. 1. Spatial evolution of first and second harmonic amplitudes of free surface elevation (upper plot) and corresponding biphase values (lower plot) in monochromatic waves propagating above mild bottom slope (0.01) (input wave height – 1.8 m, period – 8 s). Data of numeric modeling with SWASH.
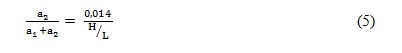
It is possible to predict value of second harmonic maximum using the following empirical formula constructed based on data of laboratory experiments [4]:
To calculate onshore component of sediment transport with Bailard’s formula (4) it is needed to know amplitudes of harmonics, phase shift between them and water depth. Properties of sediments are considered constant across the profile. Spatial evolution of determinative parameters of sediment transport from example in Fig. 1 produce following sediment transport pattern (Fig. 2).
.jpg)
Fig. 2. Onshore component of sediment transport caused by wave asymmetry calculated using Bailard’s formula. Initial data obtained with SWASH numeric model (monochromatic waves, bottom slope 0.01, input wave height – 1.8 m, period – 8 s).
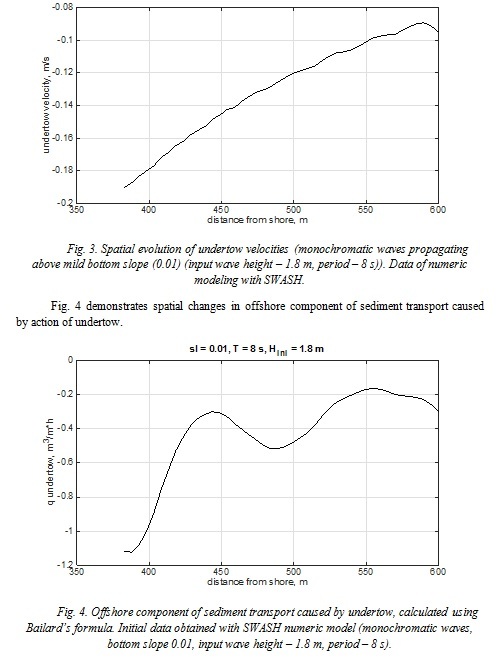
Offshore component of sediment transport is caused by action of undertow that can be estimated based on principle of mass conservation. Stokes drift leads to onshore transfer of water and undertow compensates it. Following formula represents depth-averaged value of undertow velocity [3]:

where H – significant wave height, h – water depth. Wave height grows with decreasing of depth, so undertow velocity has the following spatial distribution (Fig. 3).
Undertow causes offshore sediment transport, wave asymmetry – onshore transport, sum of these two components determines weather onshore or offshore sediment transport and, consequently, accumulation or erosion would prevail in each point of cross-shore profile. Periodical in space distribution of harmonic amplitudes and biphase lead to occurrence of maximum onshore sediment transport in the position of second harmonic amplitude maximum (Fig. 5). Balance of sediment transport in said point is used as measure of coastal vulnerability to wave action: if total sediment transport is directed to the shore in said point, coastal zone is considered resistant to this wave regime (this situation is shown in the example (Fig. 1-5)), if total sediment transport is directed seaward, than this coastal zone is vulnerable to the wave regime.


IV. APPLICATION TO ANAPA COASTS
Anapa bay-bar is extensive accumulative body, constructed by sandy deposits. It is located on Northwest part of Russian Black Sea coast (Fig. 7).
Continental shelf in this region is represented by a mildly sloping plain covered by sandy deposits. Bottom slope of Anapa bay-bar is characterized by presence of several (up to 3) sandbars [7].
During number of expeditions employees of the Southern branch of P.P.Shirshov Institute of oceanology of Russian Academy of Sciences have carried out the complex coastal research of Anapa bay-bar and obtained large amount of data concerning in particular bathymetry and grain size of bottom sediments.
It was found out that mean grain size of sediments that construct sandbar crest is 0.2 mm [8].
Mean bottom slope values fluctuate around 0.01.
Waves propagating perpendicular to the shore (in North-East direction) were chosen for analysis. According to calculations provided in [9], mean wave height of 25 yr repeatability is 3.4 m.
Anapa bay-bar coasts are characterized by presence of multiple sandbars that indicate dominance of wave regimes with periodical exchange of energy between harmonics [2]. The range of periods that will be analysed in this case is determined by two following concepts:
- to provide realization of scenarios of wave transformation with periodic exchange of energy between harmonics and significant amplitudes of second harmonics wave steepness should exceed 0.013 for mean bottom slope 0.01 (see Iribarren number criterion) – that will give upper limit of wave periods (Tmax=13 s);
- the lower limit is chosen so that waves should not break in the nearest to the shore point with maximum of second harmonic (see (5)) (Tmin=11 s)
That gives the following distribution of sediment transport in dependence on wave period (Fig. 8)
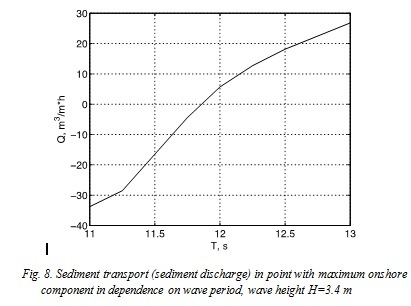
Fig. 8. Sediment transport (sediment discharge) in point with maximum onshore component in dependence on wave period, wave height H=3.4 m
As it is shown in the plot (Fig. 8), sediment transport in point with maximum onshore component is positive in narrow range of wave periods (from 11.8 to 13 s) for waves with H=3.4 m. Waves of such regimes will produce sediment transport that will change its direction from offshore to onshore and backwards along the cross-shore profile, which will construct sandbars and prevent coast from erosion. The rest of the wave regimes are more hazardous for the beaches, as offshore component of sediment transport caused by action of undertow will not be compensated by onshore component caused by wave asymmetry and bottom sediments will be removed from the coastal zone and beaches will erode.
V. CONCLUSION
On the example of Anapa bay-bar coasts new method of coastal zone vulnerability prediction was tested. The interesting point, discovered in the course of this study, is that not only steep waves can be hazardous to the coasts and cause erosion, but also very mild ones that do not grow higher harmonics. Such waves will only cause offshore sediment transport due to undertow that will not be compensated by onshore component induced by wave asymmetry.
V. ACKNOWLEDGEMENT
This study was supported by Russian Science Foundation project 14-17-00547
1. T. Abreu, F. Sancho, P. A. Silva, “Influence of nonlinear waves and undertow in sandbar development”, Coastal Engineering, 2012, pp. 1-14
2. G. Chapalain, B. Boczar-Karakiewicz, “Modeling of Hydrodynamics and Sedimentary Processes Related to unbroken Progressive Shallow Water Waves”, Journal of Coastal Research, Vol. 8, No.2, 1992, pp. 419-441
3. I. Leont'yev, Coastal Dynamics: Waves, Currents, and. Sediment Flows, GEOS, Moscow, 2001
4. Ya. Saprykina, S. Kuznetsov, M. Shtremel, V. Sundar, «Methodology of vulnerability to wave impact assessment of coastal zone on example of southern coast of Hindustan», Processes in geomedia, Vol. 3(3), 2015
5. S. Kuznetsov, Ya. Saprykina, “Experimental Test of Wave Groups Evolution in Coastal Zone”, Oceanology, 2002, Vol. 42, No. 3, pp. 1-8.
6. Ya. Saprykina , S. Kuznetsov, N. Andreeva, M. Shtremel, «Scenarios of nonlinear wave transformation in the coastal zone”, Oceanology, July 2013, Vol. 53, Issue 4, pp. 422-431
7. V. Krylenko, Environmental and antropogenous factors that determine Anapa bay-bar evolution, PhD thesis, Gelendzjik: SBIO RAS, 2011
8. V. Krylenko, A. Kochergin, M. Krylenko, «New Data about Distribution of the Grain-Size Sediment Composition of the Anapa Bay-Bar», Oceanology, 2016, vol. 56, № 1, pp. 1-6
9. R. Kosyan, Scientific support of balanced economic planning on unique marine coastal landscapes and suggestions for their use on example of the Azov-Black Sea coasts, Gelendzjik, 2013, Vol. 8, electronic publishing, http://coastdyn.ru/e-lib/tom08_2013.pdf.