


BISAC NAT010000 Ecology
BISAC NAT045050 Ecosystems & Habitats / Coastal Regions & Shorelines
BISAC NAT025000 Ecosystems & Habitats / Oceans & Seas
BISAC NAT045030 Ecosystems & Habitats / Polar Regions
BISAC SCI081000 Earth Sciences / Hydrology
BISAC SCI092000 Global Warming & Climate Change
BISAC SCI020000 Life Sciences / Ecology
BISAC SCI039000 Life Sciences / Marine Biology
BISAC SOC053000 Regional Studies
BISAC TEC060000 Marine & Naval
Submesoscale cold-core (T < 0°C) eddies were observed near the shelf break in Peter the Great Bay of the East/Japan Sea in March 2010. The observations were carried out at the moored automatic mobile profiler Aqualog station. The profiling was as frequent as every hour allowing us to obtain data with high temporal resolution. Aqualog delivered vertical profiles of ocean current velocity, acoustic backscatter at 2 MHz, temperature, and salinity between the depths of 20 m and 105 m. Below the profiling range, the InterOcean S4 current meter with temperature and salinity sensors was mounted on the mooring line. Above the profiling range, the RBR XR420 CTD logger with dissolved oxygen, chlorophyll-a fluorescence, and turbidity sensors was also mounted on the mooring line. Additionally we used the data of ship-born CTD casts, the satellite-born imagery and scatterometery, and the coastal weather station records. The data analysis suggests that the cold-core submesoscale eddies play an important role in supplying the densest water (σθ > 27.24 kg/m3) from the northern part of Peter the Great Bay to the shelf break zone where it cascades downward into the deep northern basin of the Sea. The volume of the densest water in an eddy, according to our rough estimate, is 0.5-1 km³. At the sea shelf, the densest water is richer in oxygen by 0.4 ml/l than surrounding water. It also contains much more suspended particles brought by the rivers.
Moored automatic mobile profiler, dense water transport, submesoscale cold-core eddy, Peter the Great Bay, East/Japan Sea
I. Introduction
Since the 1990s, regional physical oceanography focuses on two subpolar ventilation sources of the densest East/Japan Sea waters: open-ocean winter mixed-layer convection and brine rejection during ice formation [1,2].
Usually open-ocean convection ventilates the subpolar East/Japan Sea to intermediate depths resulting in a 300–400-meter thick mixed layer. There is also a region off Peter the Great Bay (PGB) where the open-ocean convection may reach ~1000 m depth. Ref. [3] pointed out that the best suited region for open-ocean convection is located west of 136°E between 40° and 43°N. Analysis of historical archive of the in situ temperature and salinity data [4] suggested that deep convection occurs near Vladivostok though not every winter. Ref. [5] reported on the wind enhanced by the topographic effect through the valley near Vladivostok into the East/Japan Sea that was strong enough to enhance heat loss and evaporation, which resulted in cooling of the sea surface temperature and in forming of dense water mass in Jan. 1997. Ref. [2] observed deep convection penetrating down to 1100–1500 m during the winters of 1999/2000 and 2000/2001. The newly formed bottom water was observed in the summer of 2001 after the severely cold winter of 2000/2001 in the northwestern East/Japan Sea region [6].
The coastal buoyant water is mostly cold and fresh within the narrow Primorye coastal zone and in PGB. Brine rejection during ice formation increases the density of the shelf water. It is thought that shelf water of the highest density is produced by brine rejection in PGB. The densest brine-enriched water propagates locally downward along the continental slope. The cascading water ventilates the deep layer of the sea, known as Lower Japan Sea Proper Water. This layer, below 500-1000 me depth includes a deep salinity minimum, a deep oxygen minimum, adiabatic bottom layer up to 2500 m thick , and occasionally a high-oxygen bottom boundary layer [2]. The severe winter of 2000/2001 led to so much brine rejection that a large amount of new bottom water was formed [2,6,7].
Observations of the densest water formation in PGB should help estimate the amount of the densest water formed due to brine rejection. In Feb.-Mar. 2010 at the end of winter, we conducted field trials of the moored profiler Aqualog in PGB. For test deployments we equipped the profiler with the CTD probe and the current meter that allowed for frequent observations of the vertical profiles of temperature, salinity, current velocity, and acoustic backscatter. The frequent profiling revealed two submesoscale cold-core eddies. These anticyclonic eddies transported the densest water formed in northern part of PGB to the shelf break region.
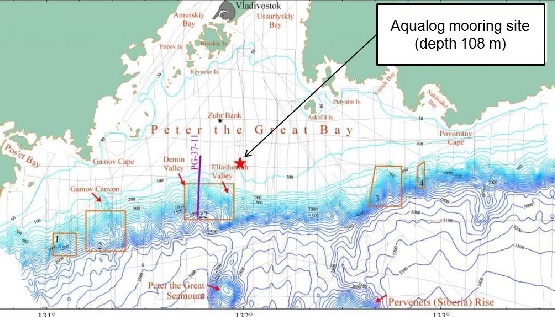
Fig. 1. Bathymetry of Peter the Great Bay area; the isobaths are drawn every 50 m within the 50-200 m depth range and every 100 m below 200 m [8]. The red star shows the location of the Aqualog profiler mooring.
II. Observations
The field experiment was carried out on Feb. 27–Mar. 14, 2010. The moored profiler Aqualog [9] was deployed near the shelf break at 132°E as shown in Fig. 1.
In PGB, the profiler Aqualog (Fig. 2) was programmed to move down and up along a mooring line with the speed of ~0.2 m/s in the depth range of 23-105 m to perform 12 ascending and 12 descending profiles with an interval of about 54 minutes; it took approximately 6 min to complete every profile. The time interval between the profiles allowed us to get the data with sufficient resolution for intermittent dynamics at ocean submesoscale, inertial scale, and the semidiurnal tidal scale. The Aqualog made 176 up-down round trips during 15 days of the survey.
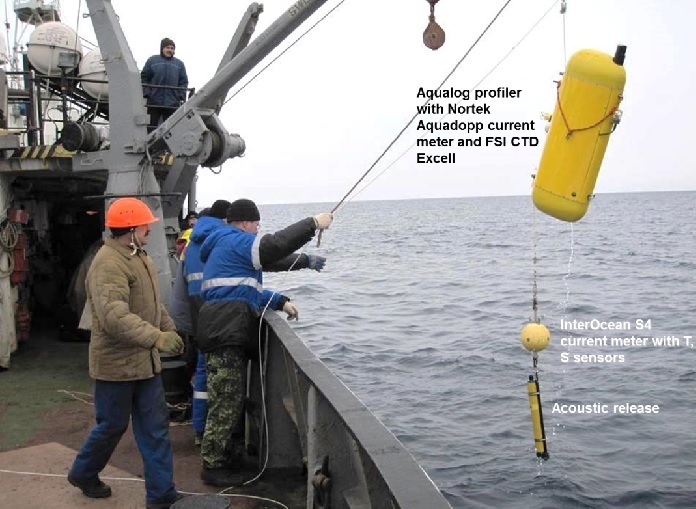
Fig. 2. Deployment of the Aqualog profiler in PGB on Feb. 27, 2010. The InterOcean S4 current meter with temperature and salinity sensors above the acoustic release is also shown.
The profiler carried the FSI Excell 2'' Micro CTD probe and the Nortek Aquadopp 3D current meter that had a horizontal beam single frequency 2 MHz instrument. Unlike conventional mooring where the equipment is placed at fixed depths, Aqualog made measurements resolution i.e., the pressure, conductivity, and temperature with a vertical resolution of ~0.2 m (fine structure resolution) and the acoustic backscatter signal and the current velocity with the resolution of ~1 m.
On the mooring line, besides the profiler Aqualog two more oceanographic instruments were installed: i) the InterOcean S4A current meter with temperature and salinity sensors above the acoustic release and an anchor (see Fig. 2) and ii) the RBR XR420 CTD logger with dissolved oxygen, chlorophyll-a fluorescence, and turbidity sensors at the depth of 18 m below the subsurface floatation.
For the deployment and recovery of the mooring we used R/V Professor Gagarinskiy. This ship also made CTD casts using SBE 911plus probe in PGB area during the survey. The ship-borne data of the casts #2, 63, and 71 of Feb. 27, Mar. 4, and Mar. 14 respectively were used for intercomparison with the mooring data.
To describe background dynamic conditions in PGB as well as the atmospheric forcing during the survey we used the Moderate Resolution Imaging Spectroradiometer data of the AQUA satellite data and the Advanced Scatterometer (ASCAT) data of the METOP satellite, respectively.
It should be noted that measurements by the FSI Excell 2'' Micro CTD probe installed at the Aqualog profiler were in good agreement with both the InterOcean S4 data and the ship-borne data of the SBE 911plus CTD casts (Fig. 3).
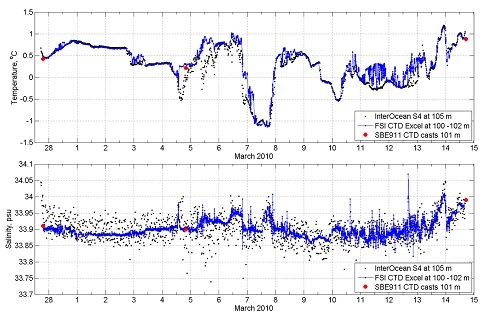
Fig. 3. Comparison of temperature and salinity data obtained using different instruments in the near-bottom layer.
III. Results
Several times during the observational survey, outbreaks of strong northerly wind brought dry and cold air into the PGB area from Siberia (see for example, Fig. 4).
The northerly winds should strengthen cyclonic gyre in the north-western East/Japan Sea. According to the satellite infrared imagery, the coastal Primorye Current was unstable in late February – first half of March 2010. In the north-western East/Japan Sea, this jet extended westward along the continental slope (Fig. 5). The surface water to the south of the boundary current was 1.5-2°C warmer than the shelf water in PGB. The mesoscale eddies with horizontal dimensions of about 20 km spin off the current.
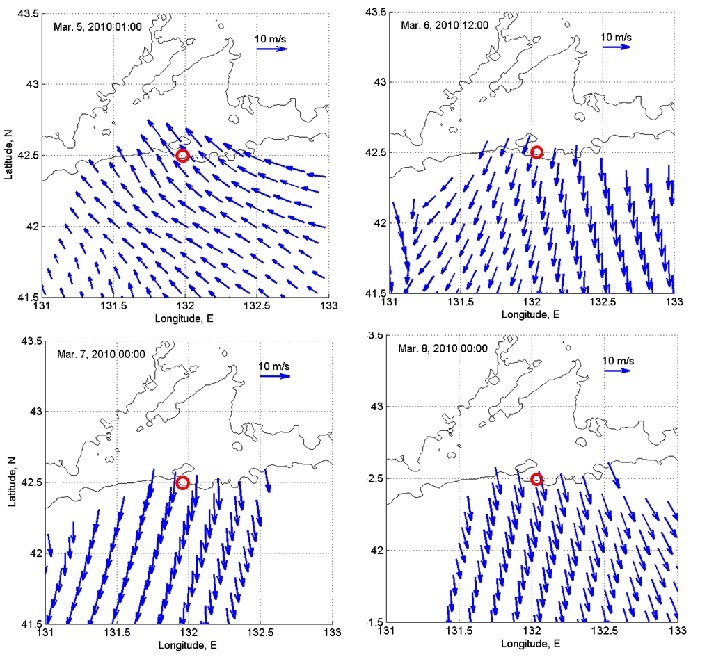 Fig. 4. The near-surface wind observed by ASCAT satellite over the north-western East/Japan Sea on Mar. 5-8, 2010. Red circle shows location of the Aqualog profiler mooring.
In the shelf zone, the dynamical structures are clear cut in the satellite MODIS imagery of the water leaving radiance at 0.551 μm and the chlorophyll-a concentration (Fig. 6). The typical horizontal scale of dynamical structures in PGB appeared to be much smaller than that in the deep basin to the south [10]. Noticeably the chlorophyll-a concentration was rather low in the Primorye Current region. The phytoplankton increased in the shelf waters to the west of Cape Povorotniy (42°40' N, 133°02' Е) in PGB where the river runoff, which was richer in nutrients, mixed with the sea water. The chlorophyll-a patches were stirred by submesoscale eddies (1–10 km, 1–102 hours) into a number of filaments separated by clear water (Fig. 6).
Although the weather conditions during the observational survey were typical for this time of the year with the air temperature at Vladivostok WMO station in the -12 – 5°C range (not shown), the cold dry wind outbreaks could increase surface cooling dramatically particularly at nights when the temperature was below 0°C.
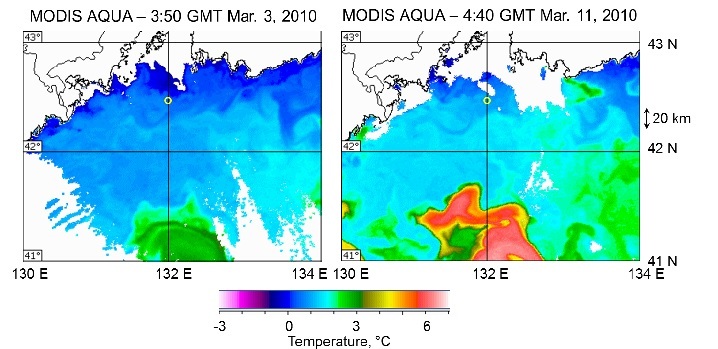
Fig. 5. The sea surface temperature in the north-western Japan Sea on Mar. 3 and 10, 2010 as observed by Moderate Resolution Imaging Spectroradiometer (MODIS) of the satellite AQUA. White circle shows location of the Aqualog profiler mooring
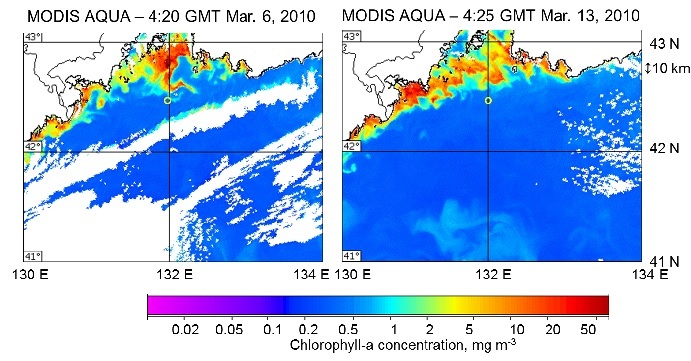
Fig. 6. The chlorophyll-a concentration in near-surface waters of the north-western East/Japan Sea on Mar. 6 and 13, 2010 as observed by MODIS AQUA. White circle shows the location of the Aqualog profiler mooring.
The CTD casts along 132°E carried out on Mar. 4 indicated the appearance of dense water with salinity higher than 34.2 psu and temperature lower than -1.6°C in the near-bottom layer in the northern part of the Ussuriyskiy Bay (Fig. 7). This water filled galleys at the bottom. It could be thought that if a galley was overfilled then tongue of the dense water propagated farther southward above nearly flat bottom (slope < 0.001°) of the sea shelf. However, the observations by the profiler mooring near the shelf break indicated a somewhat different scenario.
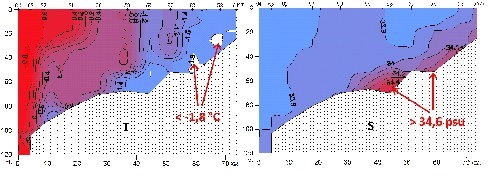
Fig. 7. The temperature (left panel) and salinity (right panel) sections along 132°E on Mar. 4, 2010. The y-axis is for the depth. The x-axis is for the distance towards the coast in the Ussuriyskiy Bay.
After unstable weather conditions the northerly wind started to blow on Mar. 6. The colder weather settled into PGB area through Mar. 11 and the air temperature dropped below -10°C for three consecutive nights of Mar. 7–9. Such a cooling could lead to formation of substantial volume of dense water. What did the profiler mooring data reveal at the PGB shelf break?
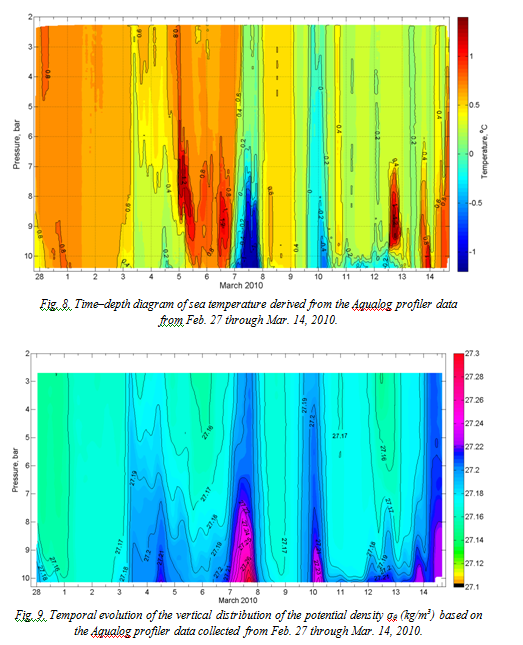
According to the Aqualog profiler observations, the cold water appeared near the mooring site on Mar. 3–4, Mar. 7, and Mar. 9–12 (Fig. 8). The most significant anomaly occurred after the passage of the thermal front through the mooring site on the night of Mar. 6. The temperature sharply decreased in the entire water column, with water colder than -0.6°C occupying the 20-30 meter thick near-bottom layer for one day of Mar. 7. Noticeably the near-bottom temperature was lower by 2–2.2°C than that of the previous 2 days. The temperature variations did not correlate with those of the salinity (see Fig. 3), which were in the 33.8–34 psu range during the survey. Noticeably, the salinity of the near-bottom water was 33.9±0.05 psu in the morning of Mar. 7; it slightly increased by 0.05 psu in the afternoon. Yet taking into account the salinity data obtained at the section along 132°E on Mar. 4 (see Fig. 7), one can argue that the observed salinity could be much lower than that in the near-bottom layer at the shallower part of the shelf at the distance of ~40 km northward.
The densest water was observed in the near-bottom layer when the temperature was less than 0°C (Fig. 9). The densest structure was observed on Mar. 7. If geostrophic approximation is applicable then the swirl velocity rotated clockwise in this structure. Hence we suggest that the observed structure was a cold-core anticyclonic eddy. The horizontal gradient of the density between the eddy core and the surrounding shelf water was strongest near the bottom. The maximum potential density in the eddy core near the bottom was 27.24 < σθ < 27.30 kg/m3. Notice that such density is typical for the Japan Sea Intermediate Water [11,12].
The current velocity pattern was typical for that produced by submesoscale eddies passing through the mooring site (upper panel of Fig. 10). The Aqualog profiler current meter data broadly agreed with those of InterOcean S4 below the profiling depth. Notice, the latter data are affected by the bottom Ekman spiral developed in the layer that could be few meters thick (lower panel of Fig. 10). The current velocity was not always in agreement with the Ekman drift. For example, the northward current was observed from the sea near-surface layer to the sea bottom from late evening of Mar. 7 till the morning of Mar. 8 though strong northerly wind (10–15 m/s) was persistent from Mar. 6 till at least Mar. 8 (Fig. 4). Hence we assume that the current velocity variability at the mooring site was largely caused by ocean submesoscale dynamics rather than wind induced circulation.
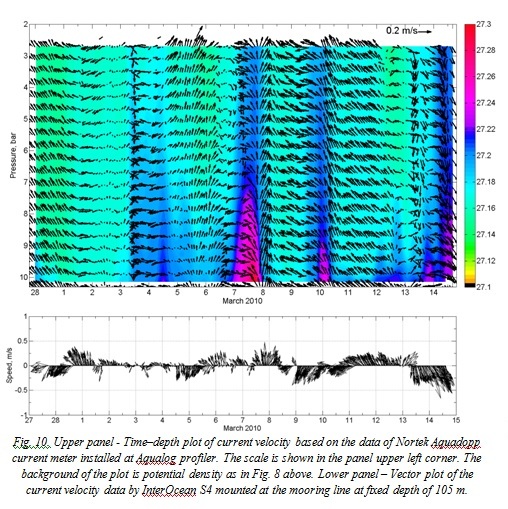
The current velocity was up to 0.25 m/s in the cold-core eddy on Mar. 7. The current velocity was quite coherent in the eddy although it was getting larger in amplitude with depth in the lower layer within 30–40 m above the bottom
Based on Fig. 10 we propose the scheme of movement of the cold-core eddy on Mar. 6–8 (Fig. 11). If we assume that the currents observed at the profiler mooring station on Mar 6–7 were caused by anticyclonic eddy then it would be logical to suggest that this vortex moved generally southeastward towards the shelf break. Notice that during the passage of the eddy the mooring station was located to the southwest of the eddy center. The eddy propagated rather slowly otherwise we could observe the mean eddy drift in the current meter data. Assuming that the outer diameter of the eddy was ~10 km (see the scale at the right vertical axis in Fig. 6) and applying the scheme at Fig. 10 we arrive at conclusion that the movement speed of the eddy was about 0.07 m/s. Since the eddy moved southeastward rather than southwestward it is unlikely that the eddy was bottom intensified. Notice that the eddy was not isolated; it interacted with the currents, the Ekman circulation generated by wind forcing, and other submesoscale eddies in PGB.
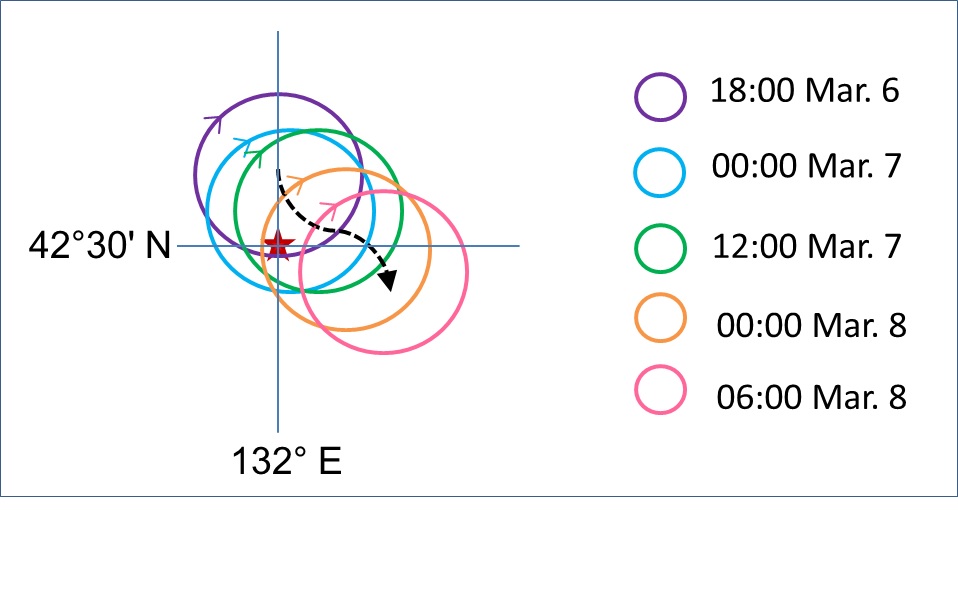
Fig. 11. Scheme for the cold-core eddy movement in PGB during Mar. 6-8, 2010. Red star marks the mooring. The color circles sequentially indicate the eddy locations (the time and data information is at the right side of the figure). The black dashed arrow shows the track of the eddy center.
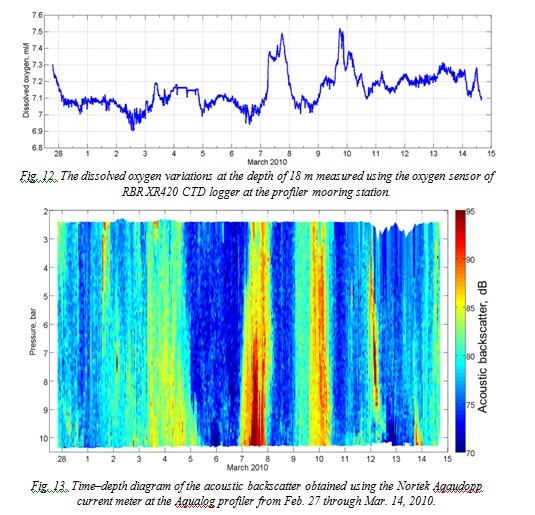
The water in the cold-core eddy was richer in oxygen (Fig. 12). In the morning of Mar. 7, the level of dissolved oxygen was still the same as on Mar. 6. It suddenly grew by 0.2–0.3 ml/l around 03:00 a.m. on Mar. 7. The dissolved oxygen content started to fall after 18:00 on Mar. 7. Most likely the eddy core passed through the mooring station in 24 hours. The eddy core diameter was smaller than 10 km. If we assume the eddy core diameter was 6-8 km then the amount of the densest water, σθ > 27.24 kg/m3, in the lower part of the eddy core, 20 meters thick, was about 0.5-1 km3.
The cold-core eddy carried water containing much more suspended particles. The Nortek Aqaudopp current meter observations demonstrated that on Mar. 7 the acoustic backscatter was much higher than background values (Fig. 13). It should be noted that the acoustic backscatter was caused by suspended particles rather than phytoplankton and mesozooplankton. This is confirmed by comparing turbidity and chlorophyll-a fluorescence measurements using the RBR XR420 CTD logger mounted on the profiler mooring station (Fig. 14).
Interestingly while the turbidity was higher during one day of Mar. 7 coherently with the dissolved oxygen variation, the fluorescence of chlorophyll-a was at its maximum late in the evening of Mar. 6 and in the morning of Mar. 7. It means that the cold-core eddy carried a nepheloid cloud. The suspended particles were either of lithogenic origin or were entrained by the swirl circulation from the bottom of the shelf. The lithogenic particles are brought by rivers into Ussuriyskiy Bay and Amurskiy Bay of PGB. Taking into account the above mentioned observations that the oxygen content was high and the salinity was enhanced in the cold-core ring we suggest that the water in the eddy core was formed recently during brine rejection when the cold weather settled into the northern part of PGB.
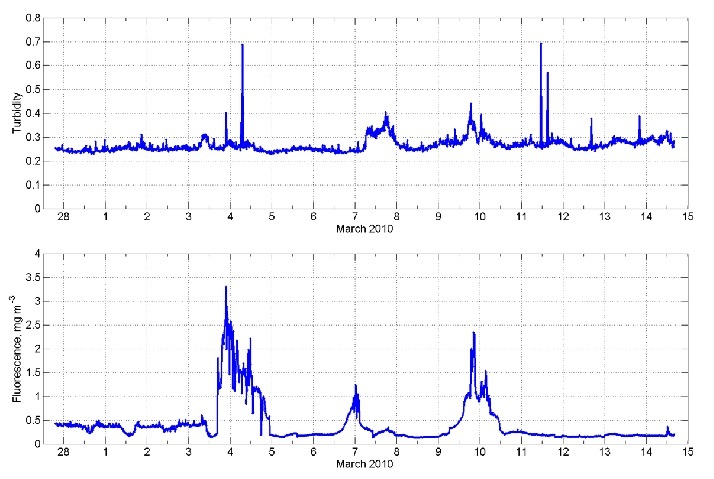
Fig. 14. The turbidity (upper panel) and the chlorophyll-a fluorescence (lower panel) at the depth of 18 m measured using the oxygen sensor of RBR XR420 CTD at the profiler mooring station from Feb. 27 through Mar. 14, 2010.
The phytoplankton was underdeveloped in the core of the cold eddy. However it bloomed in the region of the temperature front between the cold-core eddy and the waters to the south; the passage of this front was observed at the same time as the increase in the chlorophyll-a fluorescence (compare Fig. 8 with lower panel of Fig. 13).
Finally, similar patterns of potential density, current velocity and other characteristics were observed 2 days later on Mar. 9–10. In that case, the maximum density was about 27.24 kg/m3. The dissolved oxygen content was also relatively high 7.2–7.5 ml/l. This suggests that the submesoscale eddies often transport the densest water from the northern part of PGB to the shelf break.
By observing the submesoscale eddies one can roughly estimate the amount of the densest water that every winter cascades downward along the continental slope into the deep East/Japan Sea Basin.
IV. Acknowledgment
The data were collected during field trials of the moored profiler Aqualog. The trials were supported by Foundation for Assistance to Small Innovative Enterprises (FASIE), Moscow. We thank Igor Gorin Valdimir Solovyev, Dmitry Shvoev, and Aleksandr Voronin who handled the equipment during the cruises of R/V Professor Gagarinsky. Support of the crew of R/V Professor Gagarinsky is appreciated. The data analysis was carried out under Agreement between Korea Institute of Ocean Science and Technology and P.P. Shirshov Institute of Oceanology of December 15, 2015 on the scientific research project entitled Research on the Variability of the Circulation in the Northern East Sea supported by “Development of satellite based ocean carbon flux model for seas around Korea” project funded by Ministry of Ocean and Fisheries, Republic of Korea. The work was also supported by the RFBR grants 16-05-00899a and 16-55-50071jf-a and FEB RAS Far East Program grant 15-I-1-047-dv.
1. A.S. Vasiliev, and V.P. Makashin, “Ventilation of the Japan Sea waters in winter,” La Mer, vol. 30, 169-177, 1992.
2. L.D. Talley, V. Lobanov, V. Ponomarev, A. Salyuk, P. Tishchenko, I. Zhabin, and S. Riser, “Deep convection and brine rejection in the Japan Sea,” Geophysical Research Letters, vol. 30,1159, doihttps://doi.org/10.1029/2002GL016451, 2003.
3. T. Senjyu and H. Sudo, “The upper portion of the Japan Sea Proper Water: Its source and circulation as deduced from isopycnal analysis,” Journal of Oceanography, vol. 50, 663-690, 1994.
4. Y.-H. Seung and J.-H. Yoon, “Some features of winter convection in the Japan Sea,” Journal of Oceanography, vol. 51, 61- 73, 1995.
5. H. Kawamura and P. Wu, “Formation mechanism of Japan Sea Proper Water in the flux center off Vladivostok,” Journal of Geophysical Research, vol. 103, 21611 -21622, 1998.
6. T. Senjyu, T. Aramaki, S. Otosaka, O. Togawa, M. Danchenkov, E. Karasev, and Y. Volkov, “Renewal of the bottom water after the winter 2000-2001 may spin-up the thermohaline circulation in the Japan Sea,” Geophysical Research Letters, vol. 29, 1149, doihttps://doi.org/10.1029/2001GL014093, 2002.
7. K.-R. Kim, G. Kim, K. Kim, L. Lobanov, V. Ponomarev, and A. Salyuk, “A sudden bottom-water formation during the severe winter 2000-2001: The case of the East/Japan Sea,” Geophysical Research Letters, vol. 29, doihttps://doi.org/10.1029/2001GL014498, 2002.
8. V.N. Karnaukh, B.Ya. Karp, I. B. Tsoy, “Seismostratigraphy and sedimentation environment on the shelf and continental slope of Peter the Great Bay (Sea of Japan),” Oceanology, vol. 47, 261-272, 2007.
9. A.G. Ostrovskii, A.G. Zatsepin, V.A. Soloviev, A.L. Tsibulsky, D.A. Shvoev, “Autonomous system for vertical profiling of the marine environment at a moored station,” Oceanology, vol. 53, 233-242, doi:https://doi.org/10.1134/S0001437013020124, 2013.
10. S.Yu. Ladychenko, and V.B. Lobanov, “Mesoscale eddies in the area of Peter the Great Bay according to satellite data,”, Izvestiya, Atmospheric and Oceanic Physics, vol. 49, 939-951, 2013.
11. T. Senjyu, “The Japan Sea Intermediate Water; its characteristics and circulation,” Journal of Oceanography, vol. 55, 111-122, 1999.
12. L.D. Talley, D.-H. Min, V. Lobanov, V.A. Luchin, V. Ponomarev, A. Salyuk, A.Y. Shcherbina, P.Y. Tishchenko, and I. Zhabin, “East/Japan Sea Water Masses and Their Relation to the Sea's Circulation,” Oceanography, vol. 19, 32-49, 2006.