


BISAC NAT010000 Ecology
BISAC NAT045050 Ecosystems & Habitats / Coastal Regions & Shorelines
BISAC NAT025000 Ecosystems & Habitats / Oceans & Seas
BISAC NAT045030 Ecosystems & Habitats / Polar Regions
BISAC SCI081000 Earth Sciences / Hydrology
BISAC SCI092000 Global Warming & Climate Change
BISAC SCI020000 Life Sciences / Ecology
BISAC SCI039000 Life Sciences / Marine Biology
BISAC SOC053000 Regional Studies
BISAC TEC060000 Marine & Naval
This study was performed to investigate the effect of the refractory organic matter (ROM) in the marine sediment on the lengthening of the large scale generation of the hypoxic water in Ise Bay. A field survey for collecting core samples of the sediment was conducted in 2015. The analysis with the data of sedimentation rate revealed many important features. A considerable amount of ROM deposited during the period of excess eutrophication in the past was found in the sediment. The total quantity of the degradable ROM (d-ROM) per unit seafloor area was from 71 to 231 mgC/cm2. The mean characteristic time of degradation of d-ROM was about 47 years. A pelagic ecosystem - marine sediment coupled model was employed and the long-term simulation from 1950 was carried out. The simulation results showed the total quantity of d-ROM reaches its maximum at the year around 2000 and there is about a 20 year delay from the peak time of the eutrophication. This feature caused the prolongation of the higher oxygen consumption as well as the higher nutrient release from the sediment in recent years. The increase of the hypoxic water area and the volume in 2010 due to the excess ROM was about 11% and 18%, respectively. These findings show the substantial effect of ROM in the marine sediment on the persistency of water pollution.
Ise Bay, sediment core sampling, hypoxic water, refractory organic matter, pelagic ecosystem – marine sediment coupled model, nutrient budget, internal production
I. Introduction
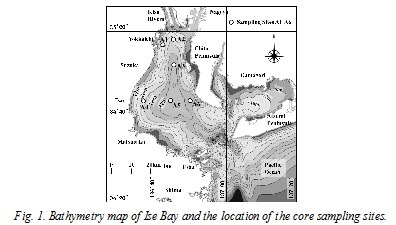
Ise Bay is located in the central part of Japan and faces the Pacific Ocean (Fig.1). Big cities such as Nagoya exist in the watershed area and the present population exceeds 10 million. Modern industries have grown in the area and have played an important role for Japanese economy. The water quality of the basin deteriorated from around 1950 to 1980 during the era of high economic growth of Japan. The regulatory enforcement aiming at the reduction of the anthropogenic pollutant load to the basin has begun in 1979 and it successfully lowered the water quality indices such as COD, TN (total nitrogen) and TP (total phosphorous) concentration in the surface water. However, such improvement has ceased and become indistinctive around 2000. The large scale generation of hypoxic water at the bottom layer of the basin’s central area has continued since 1986 when the monthly observation by Mie prefecture fisheries research institute began [1]. The understanding of the mechanism of persistency of the water pollution is an important step toward the further improvement of the environment of the basin.
Recently, Chiba, one of the authors, made an estimation that the refractory organic matter (ROM) in the sediment which was accumulated during the period of excess eutrophication in the past still is in the process of degradation and continues to have a significant effect on the environment of the basin. He performed some research works with the computer model [2][3] to quantify this estimation.
Actually, there is little information about the organic matter quantity in the marine sediment of Ise Bay. Therefore, we conducted a field survey in 2015. In this paper, we show some of the data obtained by the survey, together with the data about the depositional age and the degradation rate of the organic matter. This age relevant data was determined by using the sedimentation rate reported by Lu and Matsumoto [4].
We also show some results of the study with the computer model by applying the sediment parameters obtained by this field survey. The effect of the ROM in the sediment on the generation of the hypoxic water is discussed with these data.
II. Field Survey
The field survey was conducted on October 15 and 29, 2015, and sediment core samples were collected at the six sites shown in Fig.1. The water depth of the sites were about 15 to 36 meter. The scuba divers put acrylic pipes (1 meter in length and 8 cm in diameter) into sediment and took two core samples per site. The survey of the southern part of the bay was not planned because of the sandy seafloor around the area.
The collected samples were cut in depth-wise direction (1 cm thickness just below the seafloor), and ORP, water content, porosity, IL, AVS, COD, TOC and TN were analyzed. The CHN coder (vario MAX) was employed for TOC and TN analysis.
Before describing our data, we show the sedimentation rate in Ise Bay obtained by Lu and Matsumoto [4] in Fig.2. They measured the data by using the 210Pb method. The symbols with the initial IS and M denote the names of their observation sites. The yearly transition of the sedimentation rates are displayed in the left figure. The increasing trend of the sedimentation rate is observed for all of the data. The right figure is the isopleth of the mean sedimentation rate from 1950 to 2000. It is shown that the sedimentation rate takes maximum, minimum and intermediate values at the northern bay head area, the central bay area and the eastern bay area, respectively.
As for the increasing trend of the sedimentation rate, Lu and Matsumoto attributed the reason to the run off from construction works done on rivers and coasts in recent years. We are estimating the possibility of another reason that the reclamation of tidal flats and shallow water areas around coasts of the bay, especially those of northern bay head area, caused the loss of destination of soil from rivers (Kiso rivers for the northern bay head area) and raised the sedimentation rate.
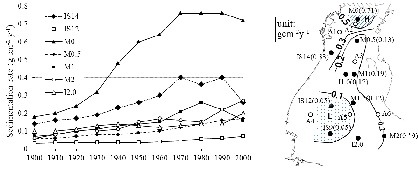
Fig. 2. Yearly transition of sedimentation rate of Ise Bay, reported by Lu and Matsumoto (left), and horizontal isopleth for its time-averaged values from 1950 to 2000. Symbols IS and M denote their measuring locations.
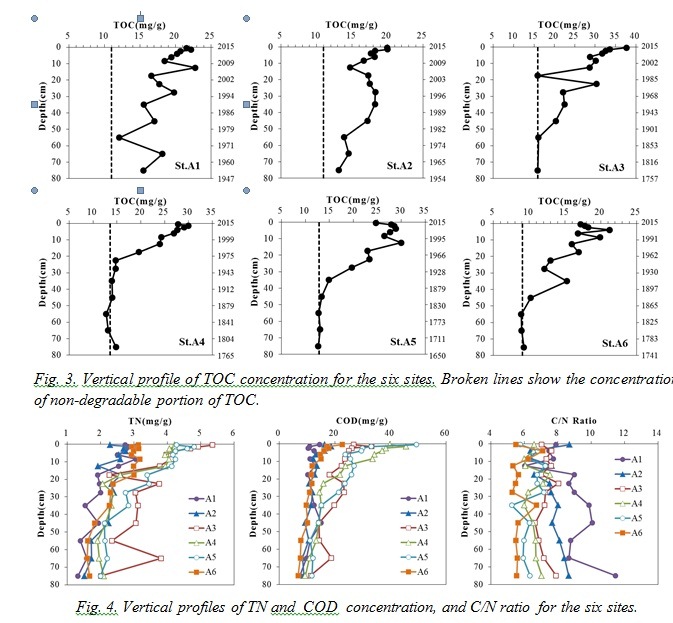
The vertical profiles of the TOC concentration for the six sites are shown in Fig.3. The depositional age estimated by the prescribed sedimentation rate was shown together. The difference in the profiles among the following three groups is to be noticed. The concentration near the seafloor as well as the decaying rate along the depth are the lowest for the northern bay head area (A1, A2), and the opposite for the central bay area (A3, A4, A5) . The data of the eastern bay area (A6) shows intermediate trend. The vertical profiles of TN, COD and C/N ratio (the weight ratio of TOC and TN) are shown in Fig.4, and the similar trend is observed in the data of TN and COD. It is considered that these differences are mainly caused by the difference of the sedimentation rate for each site.
There is also clear differences in the profile and the magnitude of C/N ratio among the three groups, and these probably indicate the difference of the origin of organic matter: i.e. the land, the outer sea and the internal production.
From here, we focus on the quantity of ROM in the sediment. The most impressive feature for us is that the considerable amount of TOC deposited during the period of the heaviest eutrophication (around 1980) was found in all the data. In order to consider the influence of these aged organic matter, the quantity of ROM is estimated by the following way.
The non-degradable TOC (n-TOC) is defined as that which was not decomposed during the process of the early diagenesis. The concentration of n-TOC for each site was estimated in Fig.3 (broken line). Since the decomposition of degradable TOC (d-TOC) was almost completed within the length of the samples from A3 to A6, the concentration at the bottom end of the samples were applied as that of n-TOC. The concentration values of n-TOC for A1 and A2 are not clear, because the decomposition of d-TOC is incomplete for the sites. Then, estimation values are applied to the sites. It should be noted that we had the simple assumption that the concentration of n-TOC is constant for all the period.
It also should be noted that the vertical profiles of d-TOC in Fig.3 mostly coincide with those of refractory component d-TOC (carbon component of ROM), as the labile component is mostly decomposed within a few months and is not resolved in the process of our analysis.
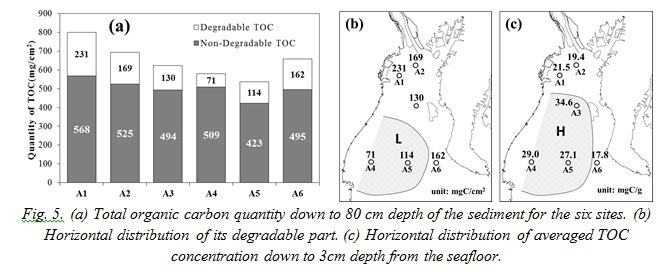
Then, the total quantities of d-TOC and n-TOC for the entire length of the core samples were computed and shown in Fig.5 (a). As seen in the figure, both data are the highest for the northern bay head area (A1, A2) and the lowest for the central bay area (A3, A4, A5). As mentioned, they may contain some error in the estimation, however, it is probable that there is substantial difference for the total quantities of TOC among the three areas of the bay.
The isopleth for the total quantity of d-TOC for the entire length of the core samples (80 cm) is displayed in Fig.5 (b) and the mean d-TOC concentration down to 3 cm depth from the seafloor is plotted in Fig.5 (c). As seen in the figures, the highest concentration area exists in the central bay area, however, the total quantity of d-TOC is the lowest at the same area. This shows the degree of contamination by the organic matter at some location should not be evaluated only by the concentration near the sediment surface.
Although the length of the sediment sample for A1 and A2 sites was insufficient and the data for the southern bay area has yet to be known, it is worthwhile to give a rough estimation for the total quantity of d-TOC (thus, ROM) for the entire bay. By taking the ensemble mean of the total quantity of d-TOC for the six sites (146 mg/cm2) and multiplying it with the total seafloor area below the water depth 10m (1,210 km2) leads tonC as the total for the entire bay. As described in the next section, the TN load from the watershed area in the year 2010 was about 120 ton. When taking the value 7 as the C/N ratio, the total amount of d-TN becomes 2.52×10⁵ tonN and it corresponds to the quantity of about 5.8 years of the TN load from the watershed area. This value is an indication when considering the amount of ROM in the sediment.
As the end of the section, the characteristic time and rate for the degradation of ROM are computed. The data is used in the computer simulation in the next section. The total quantity of d-TOC can be described by using the concentration of d-TOC and the sedimentation rate as;
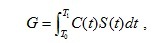 (1)
(1)
where,  is the total quantity of d-TOC from TO
  to T1
to T1  years ago (), is the present concentration of d-TOC deposited
  years ago and is the sedimentation rate years ago.
Assuming both the TOC flux to the sea floor and sedimentation rate are constant for the period from to , and taking sufficient time for () as all the d-TOC could decompose completely in the early diagenesis process, following equation is derived as;

where, is the present concentration of d-TOC deposited years ago, is the sedimentation rate (constant),  is the characteristic rate of the decomposition of d-TOC and
  is the characteristic time ().
and can be determined from the equation (2) by giving values for , , . Although, there is a little concern about over simplification of the problem, the equation (2) is sufficient to get the first approximation of the data in our study.
The data used to compute the characteristic time and rate of d-TOC and the results are summarized in Table.1. The data of A1 and A2 sites were excluded because of the incompletion of d-TOC decomposition. The equation (2) was applied to the data just below the seafloor for A3 and A4 sites, and applied to the data 10 cm below the seafloor for A5 and A6 sites. As shown in the table, the characteristic time distributes from 31 to 60 years and its ensemble average is 47 years.
Table 1. Estimation of time and rate constants for the degradation process of refractory organic matter in the marine sediment of Ise Bay
|
Location No. |
Tot. Qty. TOC |
TOC Con. (mg/g) |
Sed. Rate (g/cm2y) |
Time Const.
|
Rate Const.
|
|
A3 |
130 |
18.7 |
0.15 |
47 |
0.021 |
|
A4 |
71 |
15.4 |
0.15 |
31 |
0.033 |
|
A5 |
80 |
14.6 |
0.11 |
50 |
0.020 |
|
A6 |
114 |
9.5 |
0.20 |
60 |
0.017 |
|
Average |
|
|
|
47 |
0.021 |


III. Simulation Model
The computer simulation was performed for the period from 1950 to 2040. The computer models employed in this study are those developed by Chiba [2][3] and they consist of the hydrodynamic model and the pelagic ecosystem - marine sediment coupled model.
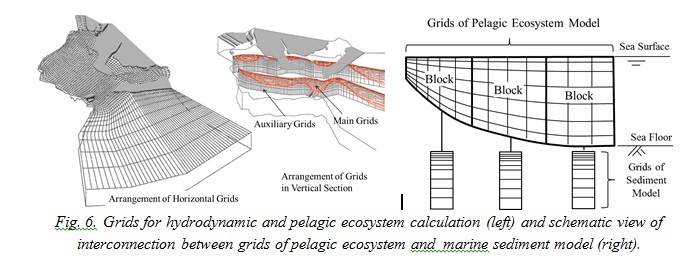
The calculation was executed on the curvilinear grid system generated along with the coastal line, the sea floor and the sea surface (Fig.6 left). The number of grid points are 107 and 103 in longitudinal and transverse direction of the bay, respectively. The number of grid points in the vertical direction is 41 for the hydrodynamic and 21 for the ecosystem calculation. The water basin is divided into 70 horizontal blocks and the marine sediment model is connected to each block, one by one (right). The number of vertical cells of the marine sediment model is 60 for all the blocks. The sedimentation rate of each block was given in accordance with Lu and Matsumoto [4] and the vertical length of the model was set from 40 to 70 cm in consideration of the sedimentation rate.
The pelagic ecosystem model was developed in accordance with the plankton model of ERSEM [5]. It includes 1 species of phytoplankton (diatom) and zooplankton, 11 abiotic compartments (particulate and dissolved organic carbon/nitrogen/phosphorus, ammonium/nitrate nitrogen, inorganic phosphorus, dissolved oxygen, hydrosulfide). The model does not contain higher trophic models and models of tidal flat.
The marine sediment model was developed by referring to the model of Fossing et al. [6]. As shown in Fig.7 (left), the degradation of organic matter (primary reaction) is processed through the five steps of bio-chemical reactions with use of deferent oxidizers (oxygen, nitrate ion, iron oxide, manganese dioxide and sulfate ion), and the reactions of bi-products of primary reaction and transportation of these materials are considered in the model. Further description of the mathematical models and parameter values is omitted due to the limitation of pages.
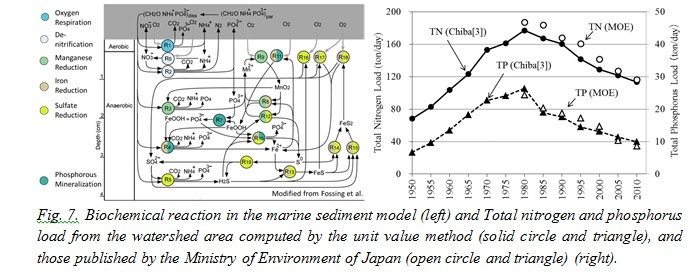
The nutrient load from the watershed area was calculated by the unit value method [3] and was used as the input data. The TN and TP data are shown in Fig.7 (right) in comparison with data published by Ministry of Environment (MOE). For the future period, the nutrient load is assumed to decrease by the rate of the recent years and to halt at the level of the year 1950.
The computation was performed in two ways. In the transient calculation, the steady state solution for 1950 was computed and used as the initial data. The transient solution after 1950 was computed by giving the nutrient load of each year. In the steady state calculation, the asymptotic solution was pursued by continuing the calculation for a few hundred years with the constant nutrient load of the target year. The evaluation of the influence from the past years can be achieved through the comparison between the transient and the steady state solutions.
In these calculations, the external conditions such as the weather, the river discharge and the water quality at the offshore boundary are fixed to those of 2010, because fluctuations due to the change of external conditions cause interference in the analysis of the effect of ROM.
IV. Simulation Results
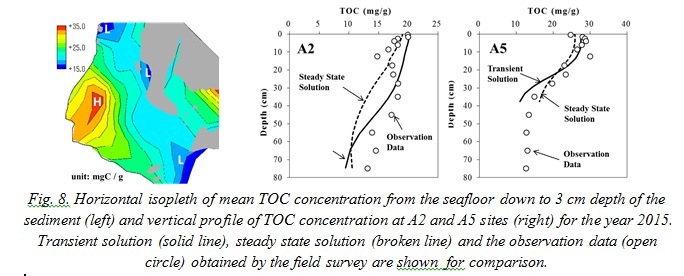
The horizontal isopleth of the mean TOC concentration from the seafloor down to 3 cm depth in 2015 obtained by the transient calculation is shown in Fig.8 (left). The overall values and the characteristics for the maxima at the central bay area were well reproduced. The vertical profile of TOC at A2 and A5 sites are shown in Fig.8 (right). The transient solution (solid line), the steady state solution (broken line) and observation data (open circle) are displayed together. The transient solutions mostly agree with the observation data. The difference between the transient solutions and the steady solutions correspond to the effect of the excess eutrophication of past years. The total quantity of d-TOC averaged over the entire bay in 2015 was 196 mg/cm2 for the transient solution and 166 mg/cm2 for the steady state solution. This result indicates that there is about 18 percent larger mass of d-TOC in the present sediment of the bay due to the effect of the excess eutrophication in the past.
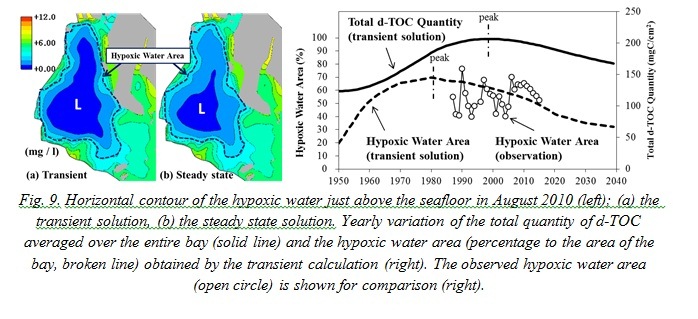
The contours of the hypoxic water mass (i.e. dissolved oxygen concentration is less than 3 mg/litter) just above the seafloor in 2010 obtained by the transient and the steady state calculation are displayed in Fig.9 (left). The apparent reduction of the size of the core area (indicated by the symbol “L”) of the hypoxic water mass is seen in the steady state solution. It was found that the mean area and volume of the hypoxic water mass during July to September in 2010 determined by the steady state calculation are about 11% and 18% smaller than those by the transient calculation.
The yearly transition of the total quantity of d-TOC averaged over the entire bay is plotted in Fig.9 (solid line, right). As shown in the figure, the data reaches the maximum at the year around 2000 and there is about a 20 year delay from the peak time of the eutrophication (i.e. the peak time of the nutrient load from the watershed area). The yearly transition of the mean area of the hypoxic water mass from July to September (broken line) obtained by the transient calculation was displayed in the same figure, together with the observation data (open circle). Although the fluctuation in the observation data is very high, the order of magnitude of the two data coincides well.
The hypoxic water area obtained by the transient calculation takes the maximum around 1980 and decreases slowly. The increment of the oxygen consumption by the effect of excess ROM evaluated by the comparison between the transient and the steady state calculation was about 6.5% in 2010. These results indicate the probability that the lump of the excess ROM in the sediment and the time delay of its accumulation cause the prolongation of the higher oxygen consumption and the decrease of shrinking rate of the hypoxic water mass in recent years.
V. Nutrient Usage In Internal Production
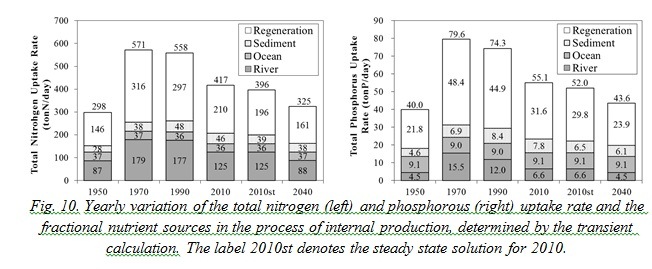
The quantity of nitrogen and phosphorus taken up by the phytoplankton was computed to investigate the effect of ROM in the sediment on the internal production. The yearly variation of the TN and TP quantity (uptake rate) taken up from the different sources were summarized in Fig.10. Here, it is noted that the nutrients from the sediment only contain those from ROM.
The quantities of the regenerated TN and TP are remarkable in the data and they account for about half of the whole. These regenerated nutrients include those generated in the material circulation (i.e. withering, ingestion and excretion of zooplankton, etc.). Sugimoto et al.[7] describes the amount of the regenerated nitrogen used in the internal production in Ise Bay reaches 50% of the total amount of nitrogen. Their result coincides with the present data.
The TN and TP quantities in 2010 determined by the transient calculation are 417 tonN and 55.1 tonP, and those by the steady state calculation are 396 tonN and 52.0 tonP. Therefore, the increase of the nutrient quantity taken up in the internal production due to the excess ROM is around 5%. Although this amount is a little bit smaller than we expected, it should be recognized that the influence on the internal production by the same rate continues for decades and the lengthening of water pollution takes place.
VI. Summary
The field survey of the sediment and the consecutive analysis revealed that the a considerable amount of the refractory organic matter (ROM) deposited during the era of high economic growth in Japan remains in the sediment in Ise Bay. The computer simulation with the use of the ROM decomposition rate derived from the analysis of the sampled sediment could roughly reproduce the change of the environment and quantify the effect of ROM on the generation of hypoxic water of the bay. Further study including that for the sensitivity of solutions against model parameters is required to enhance the reliability of the results described in this paper.
1. Mie Prefecture Fisheries Research Institute, “The Result of Observation on the Fixed Stations in Ise Bay”, Mie Prefecture Fisheries Research Institute, 1986~2015 (in Japanese).
2. S. Chiba, “Hindcast Simulation of Water Quality and Flow and Study of Seawater-Exchange Characteristics of Ise Bay for the Year 2010 and 2011”, J.JSCE, Ser.B2, Coastal engineering, vol. 69, No. 2, p. I_1071-I_1075, 2013 (in Japanese with English abstract).
3. S. Chiba, “Long-term Simulation for Water and Sediment Quality of Ise Bay by a Pelagic - Marine Sediment Coupled Ecosystem Model”, J.JSCE, Ser.B2, Coastal engineering, vol.71, No.2, p.I_1255-I_1260, 2015 (in Japanese with English abstract).
4. X. Lu, E. Matsumoto, “Recent sedimentation rates derived from 210Pb and 137Cs methods in Ise Bay, Japan”, Estua-rine, Coastal and Shelf Science, vol.65, Iss.1-2, pp.83-93, 2005.
5. M. Vichi, J. Baretta, J. Baretta-Bekker, W. Ebenhoh, C. Kohlmeier, P. Ruardij, N. Pinardi, and M. Zavatarelli, “European Regional Seas Ecosystem Model III, Review of the biogeochemical equations”, www.bo.ingv.it/ersem3/ERSEM_III_report.lyx,v 1.6 2004/07/28 10:44:29 mav Exp, 2004.
6. H. Fossing, P. Berg, B. Thamdrup, S. Rysgaard, H.M. Sorensen, K.A. Nielsen, “Model set-up for an oxygen and nutrient flux for Aarhus Bay (Denmark) ”, National Environment Research Institute (NERI) Technical Report No. 483. Ministry of Environment, Denmark, 2004.
7. R. Sugimoto, A. Kasai, T. Miyajima, K. Fujita, “Modeling phytoplankton production in Ise Bay, Japan: Use of nitrogen isotopes to identify dissolved inorganic nitrogen sources”, Estuarine, Coastal and Shelf Science, vol.86, pp.450-466, 2010.