


BISAC NAT010000 Ecology
BISAC NAT045050 Ecosystems & Habitats / Coastal Regions & Shorelines
BISAC NAT025000 Ecosystems & Habitats / Oceans & Seas
BISAC NAT045030 Ecosystems & Habitats / Polar Regions
BISAC SCI081000 Earth Sciences / Hydrology
BISAC SCI092000 Global Warming & Climate Change
BISAC SCI020000 Life Sciences / Ecology
BISAC SCI039000 Life Sciences / Marine Biology
BISAC SOC053000 Regional Studies
BISAC TEC060000 Marine & Naval
Variability of the bio-optical characteristics may be as indicator of changes in the functioning of ecosystems, for example the eutrophication, the organic matter pollution and the hypoxia of water body. In this work we study according to data, obtained by means of the satellite MODIS-Aqua spectroradiometer, the variability of bio-optical characteristics (concentration and fluorescence of chlorophyll-a (Cchl and Fchl), coefficients of light absorption by detritus and yellow substance (adg) and light backscattering by suspended particles of mineral and biological origin (bbp)) along sections extending from the shelf (Amur and Ussuri Bays) toward the seaward area of Peter the Great Bay from January to December of 2007, 2008, 2013, 2014. Features of the seasonal Cchl satellite variability along the selected sections were shown. It is noticed that the highest Cchl satellite values are characteristic for the Amur Bay, usually from place of confluence of the Razdolnaya River from late May - June to August – September. Separate cases of increased values of bbp in area, which stretches from the Vladivostok coast, were revealed. In the first case, the area of the increased values of bbp corresponded to area, having the Fchl values close to zero, and in second case – to area with the increased Fchl. Possible, the first case can be caused by the increase in content of the mineral origin suspension because of some building works, and the second case is due to the discharge of water by reservoirs. It is noticed that the increased values of bio-optical characteristics except Fchl are characteristic for the scenarios with the increased wind speed and after the atmospheric precipitation. Increased Fchl values are characteristic at the sufficient rainfall, contributing to rising of the rivers level, or the increase of wind speed to about 8 m/s and above.
changes in the functioning of ecosystems, phytoplankton bloom, MODIS-Aqua, bio-optical characteristics, Sea of Japan
I. Introduction
Peter the Great Bay (PGB) is located in the north-western area of the Japan Sea between the parallels of 42o 17’ and 43o 20’ N and the meridians of 130o 41’ and 133o 02’ E. It is divided into two large bays: the Amur and Ussuri (fig. 1). Rivers play important role at the functioning of coastal ecosystems. Rivers of the Razdolnaya (one of the major rivers of southern Primorye), Amba, Shmidtovka, Bogataya, Sedanka, Barabashevka, Narva flow into the Amur Bay. Rivers of the Artemovka, Shkotovka, Sukhodol, Petrovka flow into the Ussuri Bay. Domestic waste water of the Vladivostok city and other settlements render the significant influence on the Amur Bay ecosystem. At the continental runoff the water with the high content of nutrients, organic matter, mineral suspension flows down into reservoirs. It leads to eutrophication of reservoirs and attenuation of light propagation in the water. Lack of light in the subsurface horizons with the muddy water is cause of the photosynthesis extinction and the algae cells doom. Their decomposition is additional source of the water pollution by organic matter. Microbiological oxidation of organics at weak dynamic processes in waters with depth of the euphotic layer less than the basin depth leads to hypoxia of the bottom waters. According to data of expeditionary observations in the Amur Bay the hypoxia of the bottom waters was revealed in August of 2007 and 2008 [1, 2].
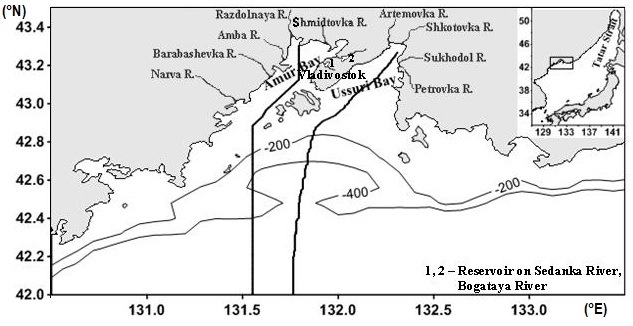
Fig.1. Location of the Peter the Great Bay in the Sea of Japan (the sidebar on the right) is shown. Black lines extending from the inner part of the Amur and Ussuri Bays toward the seaward area mean the sections, where the seasonal variability of Cchl satellite was studied. On the section in the Amur Bay the bio-optical characteristics from May to September were also studied. Location of some rivers confluence in Amur and Ussuri Bays is shown. Also the isolines of depths of 200 and 400 m are shown.
Variability of the bio-optical characteristics may be as indicator of changes in the functioning of ecosystems, for example the eutrophication, the organic matter pollution and the hypoxia of water body. These characteristics are the concentration and fluorescence of chlorophyll-a (respectively Cchl and Fchl), coefficients of light absorption by detritus and yellow substance (“gelbstoff”, colored dissolved organic matter (CDOM)) (adg) and light backscattering by suspended particles (bbp). Timely detection of the establishment of this biogeochemical state is the motive for actions aimed at its change. These characteristics, obtained by satellite ocean color observations with the temporal resolution of 8 days, 1 day and the spatial resolution of 4km × 4km, 1km × 1km, respectively allow monitoring the waters in the cloudless days. Predominance of the absorption by detritus and yellow substance in comparison with the absorption by phytoplankton pigments may be the cause for overestimate of Cchl satellite [3, 4, 5, 6]. Content of detritus and yellow substance in the reservoir mainly reflects the combination of degradation products of phytoplankton blooms and continental runoff. Content of detritus and yellow substance in open ocean waters is regulated by the speed of photobleaching, processes of water exchange, biological production, determined by the vital activity of algae, zooplankton, bacterioplankton, viruses [7].
The aim of this work was:1) according to the 8-day composite data to allocate the maximum Cchl satellite values at studying of the seasonal variability of this characteristic on two sections extending from the inner part of Amur and Ussuri Bays towards the seaward part of Peter the Great Bay; 2) according to daily level 2 data to study the variability of bio-optical characteristics in 2007, 2008, 2013, 2014 at the spatial-temporal interval established on the maximum Cchl satellite values, and to compare this variability with hydrometeorological conditions.
II. Data and methods
According to data averaged for four years (2007, 2008, 2013, and 2014) the seasonal variability of Cchl satellite parameter estimated for 8 days (data of level 3 from the Ocean Color web portal – http://oceancolor.gsfc.nasa.gov) was considered on two sections highlighted by us in the Amur and Ussuri Bays. Data of level 3 reflect the distribution of ocean color characteristics for the entire World Ocean, therefore they are constructed on the classical scheme of atmospheric correction (NIR (Near-Infrared) - correction). Location of the sections is shown in fig. 1. As a result, the features of seasonal Cchl satellite variability and the spatial-temporal interval with the maximum Cchl satellite values as the zone having the biogeochemical condition of ecosystem with the high level of organic matter were revealed. At that, only the Cchl satellite characteristic was used, because of Cchl satellite dependent on the other components containing in the water and affecting the light propagation and indicating on the water pollution by organic matter, and also bbp has usually small values. Cchl satellite is determined from the remote sensing reflectance (Rrs) observation. Rrs depends on the concentrations of components determining the water color: ,

where
and p stand for water, phytoplankton, detritus and yellow substance (“gelbstoff”) and suspended particles (mineral and biological origin) respectively, Kph, Kdg and Kp stand for the corresponding concentrations, and the asterisks indicate specific coefficients [4, 8, 9].
We considered more detail the variability of Cchl satellite and other ocean color characteristics on the revealed spatial-temporal interval. This interval is in the Amur Bay from May to September. To make it the data of daily level 1A (data about the upwelling radiance) were downloaded from the Ocean Color web site for the cloudless days. These data were from MODIS-Aqua spectroradiometer. They were processed to level 2 using the SeaDAS 6.4. At level 2 we obtained the data on Cchl satellite, estimated by OC3M algorithm, adg(443)_QAA, bbp(443)_QAA obtained at a wavelength of 443 nm by Quasi-Analytical Algorithm, the Fchl Line Height, normalized on radiance downloaded to sea surface (nFLH) at a wavelength of 678 nm, and Sea Surface Temperature (SST). FLH is defined as the difference between chlorophyll-a fluorescence and “baseline radiance”, which is determined through linear interpolation of radiances on the spectral bands at 667 and 748 nm [10]. Light absorption by detritus and yellow substance is in blue and violet region of the spectrum, the Fchl is in red region. Therefore, CDOM does not almost influence on estimates of the FLH [6, 11]. FLH depends on Cchl, the spectrally-averaged, chlorophyll-specific phytoplankton absorption coefficient, the flux of photosynthetically active radiation, and the quantum yield of fluorescence [10]. At obtaining of data of level 2 we used MUMM (Management Unit of the North Sea Mathematical Models) atmospheric correction recommended for turbid coastal waters [12]. More informative satellite scenes of the variability having most level of Cchl satellite were chosen and presented on fig. 3. As a rule, the bbp values are relatively small and on the estimates of Rrs and Cchl satellite have little effect. However, in case of high values of bbp the estimates of Cchl satellite will be underestimated and Cchl satellite can not be as indicator of high level by organic matter content. Also the individual satellite scenes of bio-optical characteristics for the investigated region were reviewed and compared with the hydrometeorological parameters (speed and direction of wind, quantity of atmospheric precipitations). Data on the speed and direction of wind, the quantity of atmospheric precipitations were taken from the web portals http://oceancolor.gsfc.nasa.gov (the Giovanni online data system, developed and maintained by the NASA GES DISC) and http://rp5.ru.
III. Results and discussion
Seasonal Cchl satellite Variability and its Maximums
On fig. 2 the main features of the seasonal Cchl satellite variability at the sections in the Amur and Ussuri Bays are shown. Number near lines means number of the 8-days period from the beginning of the year. On fig. 2 (a, c, e) the Cchl satellite variability on the section in the Amur Bay is shown, and on fig. 2 (b, d, f) - in Ussuri Bay. The first row of figures shows the Cchl satellite variability in the winter-spring period, the second row - in the summer, and the third row - in the autumn-winter period. Relatively low Cchl satellite values close to zero are typical for the beginning of the year (line 2). This is a result of the phytoplankton succession termination due to the lack of light for photosynthesis because the phytoplankton together with the water flows at the convective mixing is carried away into the lower layers. Winter-spring bloom of phytoplankton in the shelf zone (lines 8, 10) starts with establishing the water stratification. Its establishment occurs at combination of processes of decrease of the wind mixing, desalinating of surface water, the seasonal warming of water, and the slip along shelf slope near the bottom of the more dense water formed as a result of ice formation. Also the increase of organic matter content in the water influences on the increase of Cchl satellite value during and after the phytoplankton bloom [13; 14]. Then phytoplankton bloom moves in the seaward part of PGB (lines 12, 14, 16), where the water warming and the desalinating of surface layer in the Primorye Current because of ice melting in the Tatar Strait influence on the establishment of water stratification. In the Amur Bay the increase of Cchl satellite (lines 12, 14, 16) is traced. It is caused by a high water on the Razdolnaya River. In summer for the seaward part of PGB the low Cchl satellite values are typical. High Cchl satellite values at this time are typical only for areas close to the inflow of the rivers, since together with their water the high concentrations of nutrients and organic matter are available. On sections these areas correspond to latitudes from 43.3 to 42.9° N in the Amur Bay and from 43.3 to 43.1° N in the Ussuri Bay (fig. 2(c, d)). In autumn-winter for areas close to the inflow of rivers a gradual decrease of Cchl satellite (lines 35, 36, 39) is typical. In autumn-winter the increase of Cchl satellite (lines 39, 40, 44) is due to the inflow of nutrients into the upper euphotic layer from the underlying layers through convective mixing of water. With increasing of the convective mixing the phytoplankton development is stopped because of light lack for photosynthesis. Further we consider in more detail the variability of bio-optical characteristics in the Amur Bay during time when are observed relatively high Cchl satellite values – from May to September.
Features of Bio-Optical Characteristics Variability in Amur Bay
Most informative and with the greatest level of the Cchl satellite values the variabilities and the corresponding variabilities of adg(443)_QAA and bbp(443)_QAA along the section in Amur Bay from 43.3°N to 42.63°N in 2007, 2008, 2013, 2014 are presented on fig. 3. Date, which corresponds to the variability, is shown near the lines in bottom of picture. Highest levels of the Cchl satellite variability were observed for 2007 in June (line for 2007/06/14), for 2008 in June (line 2008/06/14), for 2013 in August (line for 2013/08/21), for 2014 in late May (line for 2014/05/30) (fig. 3). Before 2007/06/14 the atmospheric precipitations in the form of drizzle were observed. Drizzle caused the softening of the soil with corresponding runoff to the bay. Obviously, it was cause of high values for bio-optical characteristics with the exception of nFLH (fig. 4). For 2007 the high Cchl satellite values are observed also in August (line for 2007/08/23). For this variability the sharp differences of Cchl satellite values from high to low and vice versa are allocated (fig. 3, 4). We believe that distribution of this characteristic is caused by wind mixing of surface layer with the underlying water having high content of detritus and yellow substance.
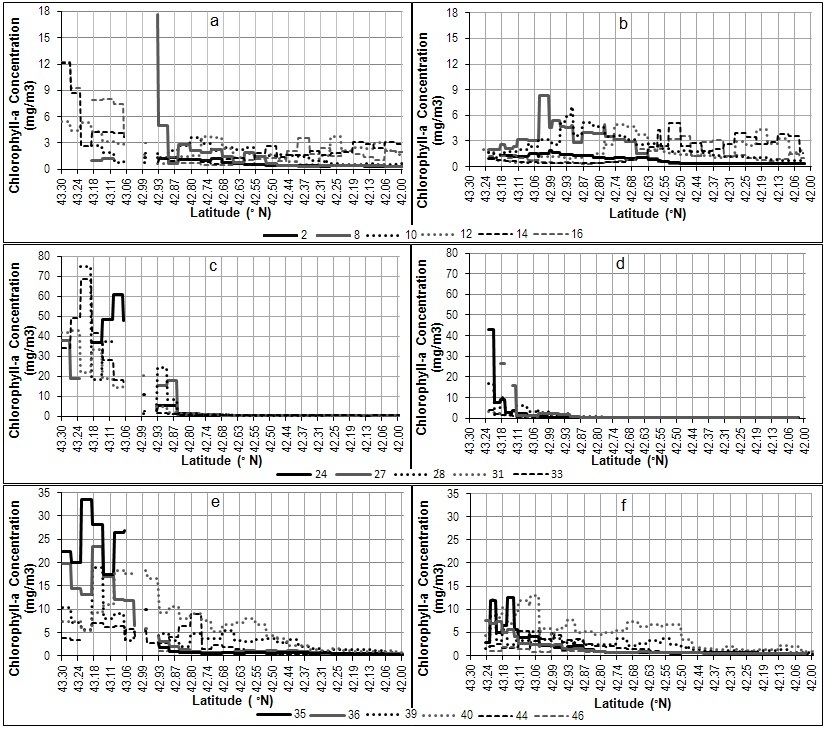
Fig.2. Seasonal variability of Cchl satellite values, averaged for four years (2007, 2008, 2013, 2014), on the sections extending from Amur and Ussuri Bays (respectively from left and right). Number near lines means number of the 8-days period from the beginning of the year. The 46-th period is from 361 to 365 day for 2007, 2013, 2014, and from 361 to 366 day for 2008
It was noted that from the 19th to 22nd August the wind changed from south-eastern direction and speed about 2-3 m/s on the north-western wind having speed of 6-8 m/s. It is also necessary to note that on the 18th August the heavy rainfall was recorded. It can be the cause of the increase of nutrients and organic matter content due to the continental runoff. However, the distributions of bio-optical characteristics except for nFLH on the 19th August were characterized by relatively low values in calm conditions (as mentioned above, the wind speed was 2-3 m/s) (fig. 4). Detritus, yellow substance, suspended particulates, which arrived together with the continental runoff on the 18th August, could go down during day into the lower layers of water. Atmospheric precipitation and the increased wind speed preceded to the increased bio-optical characteristics. This fact testifies to the predominance of yellow substance, detritus and the lack of light conditions for photosynthesis in the subsurface water which was raised to the surface by wind mixing. Before 2008/06/14 the torrential rains sometimes were observed. Distributions of the bio-optical characteristics were approximately analogical to distributions for 2007/06/14. Only area of the increased values of bbp(443)_QAA, which is not explained by the influence of the Razdolnaya River, was noticed. We present distribution of the bio-optical characteristics for 2008/06/11 to show the case with increased values of bbp(443)_QAA near the Vladivostok coast in comparison with other days. Possible, this case is caused by some building works. Area, having very high values of bbp(443)_QAA, from the Vladivostok coast was observed on 2013/08/09(fig. 5). This area may be related to the discharge of water by the reservoirs. High level of Cchl satellite on 2013/08/21 (fig. 3) and the increased values of other bio-optical characteristics may be associated with increase of water level in the rivers because of torrential rains on 2013/08/19. Case of high Cchl satellite on 2014/05/30 is approximately analogical to cases on 2007/06/14 and 2008/06/14 (fig. 3), and case of sharp increase for all bio-optical characteristics on 2014/09/18 (fig. 5) can be related to the wind mixing due to the increase of wind speed to 8 m/s.
IV. Conclusion
Complexity of the occurring processes (chemical, biological, hydrodynamic), caused by changes of the quantity and content of continental runoff, the speed and direction of wind, the anthropogenic influence and the absence of satellite data because of the cloudiness strongly complicate the study of the bio-optical characteristics variability. Study of these characteristics variability separately by year and their comparison with hydrometeorological information has allowed to assert that the increased values except Fchl are characteristic for the scenarios with the increased wind speed and after the atmospheric precipitation. Increased values of Fchl are characteristic at the sufficient rainfall, contributing to rising of the rivers level, or the increase of wind speed to about 8 m/s and above. Wind executes the mixing of surface with the underlying waters enriched by nutrients. Separate cases of the increased bbp values in area which stretches from the coast of Vladivostok are also highlighted. In the first case, area of the increased bbp values corresponded to area, having the Fchl values close to zero, and in second case – to area with the increased Fchl. The first case can be caused by the increase in content of the suspension of mineral origin because of some building works, and the second case is due to the discharge of water by reservoirs. Light attenuation because of increase in the light backscattering by suspended particles can be as the cause in death of photosynthetic plants in undersurface layers and, hence, contributes to the formation of water hypoxia.
V. Acknowledgment
The authors are grateful for the partial financial support provided by Far East Program of Russia (15-I-1-045). We thank the Ocean Biology Processing Group (OBPG) at NASA's Goddard Space Flight Center for providing data of level 1A and level 3, the Giovanni online data system, developed and maintained by the NASA GES DISC for the atmospheric precipitation data, the Weather Schedule Company for data on the wind speed and direction and the atmospheric precipitation.
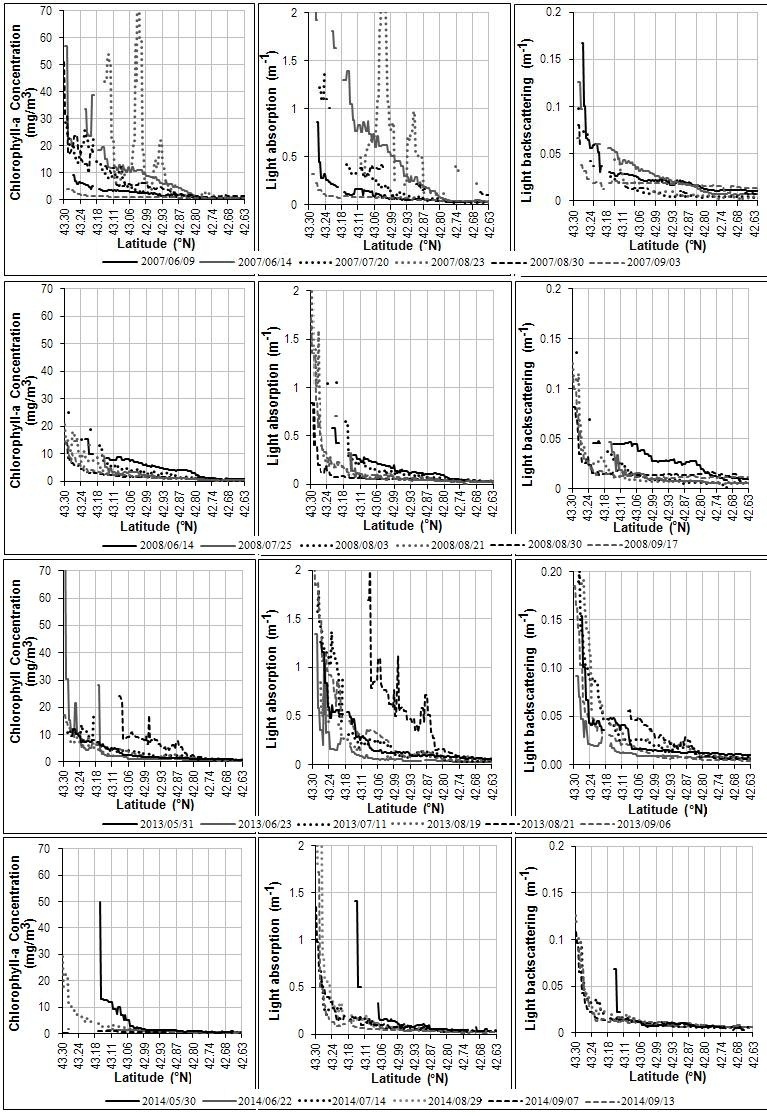
Fig.3. Most informative and with the greatest level of the Cchl satellite values the variabilities and the corresponding variabilities of adg(443)_QAA and bbp(443)_QAA along the section in Amur Bay from 43.3°N to 42.63°N in 2007, 2008, 2013, 2014. In bottom of pictures near lines the date, which corresponds to the variability, is presented.
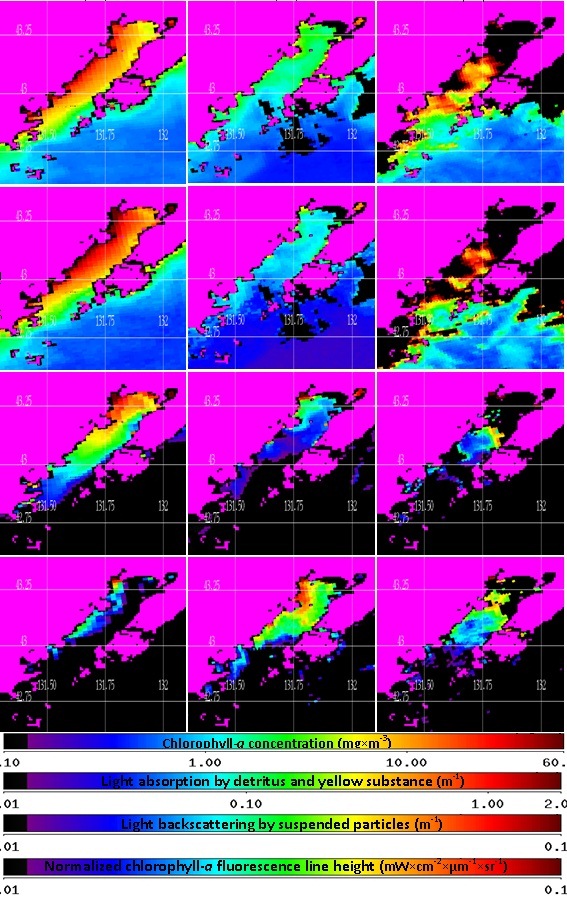
Fig.4. Distributions of the bio-optical characteristics in Amur Bay in 2007.
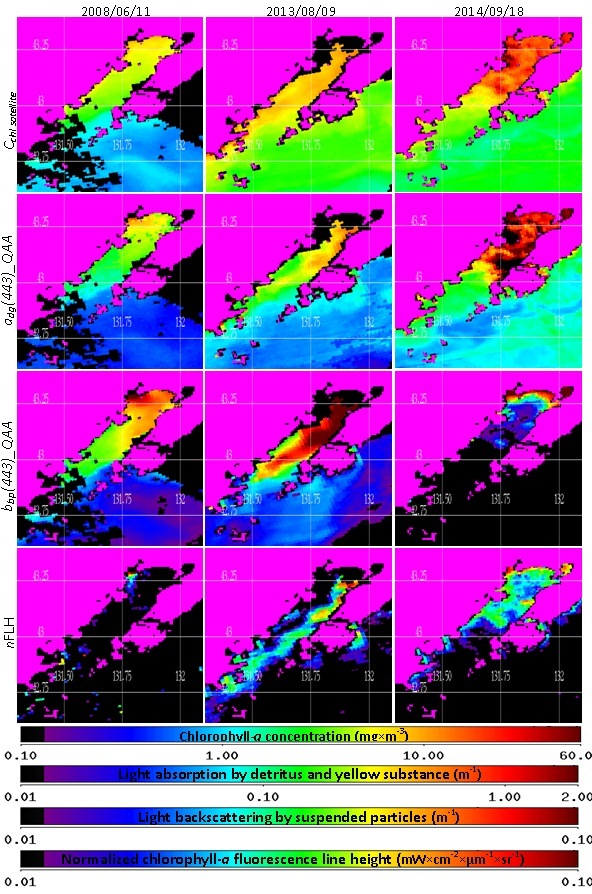
Fig.5. Distributions of the bio-optical characteristics in Amur Bay in 2008, 2013, 2014.
1. P.Ya. Tishchenko, A.F. Sergeev, V.B. Lobanov, V.I. Zvalinsky, A.M. Koltunov et al., “Hypoxia of the bottom waters of Amursky Bay”, Vestnik of FEB RAS, № 6, 2008, pp. 115-125.
2. P.Ya. Tishchenko, V.B. Lobanov, V.I. Zvalinsky, A.F. Sergeev, T.I. Volkova et al., “Seasonal hypoxia in the Amur Bay (Japan Sea)”, Izv. TINRO, vol.165, 2011, pp. 136-157.
3. V.I. Burenkov, O.V. Kopelevich, S.V. Sheberstov, S.V. Ershova, M.A. Evdoshenko, “Bio-optical characteristics retrieved from satellite ocean color data”, The Eastern Mediterranean as Contrasting Ecosystems, Kluwer Academic Publishers, Netherlands, 1999, pp. 313-326.
4. V.I. Burenkov, O.V. Kopelevich, S.V. Sheberstov, V.I. Vedernikov, “Sub-satellite measurements of the ocean color: validation of the SeaWiFS satellite scanner data”, Oceanology, vol. 40, № 3, 2000, pp. 357-362.
5. Y.V. Fefilov, “Development and creation of information technology remote determination of primary productivity parameters in ocean monitoring systems”, Cand. Dis. k-ta tehn. Sciences, Moscow, 2003, p. 19.
6. P.A. Salyuk, I.E. Stepochkin, I.A. Golik, O.A. Bukin, A.N. Pavlov et al., “Development of empirical algorithms for recovering of the chlorophyll-a concentration and CDOM for the Far-Eastern Seas from remote sensing data on the color of the water surface”, Research of Earth from Space, № 3, 2013, pp. 45-57.
7. D.A. Siegel, S. Maritorena, N.B. Nelson, “Global distribution and dynamics of colored dissolved and detrital organic materials”, J. of Geophys. Res., vol. 107, № S12, 2002, 3228, doihttps://doi.org/10.1029/2001JC000965.
8. H.R. Gordon, O.B. Brown, M.M. Jacobs, “Computed relationships between the inherent and apparent optical properties of a flat homogeneous ocean”, Applied Optics, vol.14, 1975, pp.417-427.
9. “Remote Sensing of Ocean Color in Coastal, and Other Optically-Complex Waters”, in Reports of the International Ocean-Color Coordinating Group, № 3, S. Sathyendranath, Eds., Dartmouth, Canada, 2000, pp. 34-36.
10. M.J. Behrenfeld, T.K. Westberry, E.S. Boss, R.T. O’Malley, D.A. Siegel et al., “Satellite-detected fluorescence reveals global physiology of ocean phytoplankton”, Biogeosciences, vol. 6, 2009, pp.779-794.
11. P. Salyuk, O. Bukin, A. Alexanin, A. Pavlov, A. Mayor et al., “Optical properties of Peter the Great Bay waters compared with satellite ocean colour data”, International Journal of Remote Sensing, vol. 31, № 17-18, 2010, pp. 4651-4664.
12. K.G. Ruddick, F. Ovidio, M. Rijkeboer, “Atmospheric correction of SeaWiFS imagery for turbid coastal and inland waters”, Applied Optics, vol. 39, № 6, 2000, pp. 897-912.
13. E.A. Shtraikhert, S.P. Zakharkov, T.N. Gordeychuk, Ju.V. Shambarova, “Chlorophyll-a concentration and bio-optical characteristics in the Peter the Great Bay (Sea of Japan) during the winter-spring phytoplankton bloom”, Current problems in remote sensing of the Earth from space, vol. 11, № 1, 2014, pp. 148-162.
14. E.A. Shtraikhert, S.P. Zakharkov, “About the spatial-temporal chlorophyll-a concentration variability on shelf of Peter the Great Bay during winter-spring phytoplankton bloom on satellite and sub-satellite data”, Research of Earth from Space, № 1-2, 2016, pp. 173-186.