


BISAC NAT010000 Ecology
BISAC NAT045050 Ecosystems & Habitats / Coastal Regions & Shorelines
BISAC NAT025000 Ecosystems & Habitats / Oceans & Seas
BISAC NAT045030 Ecosystems & Habitats / Polar Regions
BISAC SCI081000 Earth Sciences / Hydrology
BISAC SCI092000 Global Warming & Climate Change
BISAC SCI020000 Life Sciences / Ecology
BISAC SCI039000 Life Sciences / Marine Biology
BISAC SOC053000 Regional Studies
BISAC TEC060000 Marine & Naval
This paper is devoted to the use of long-term remote sensing (RS) data for assessment of anthropogenic impacts on the coastal water environment of the Neva Bay (NB) and the eastern part of the Gulf of Finland (EGOF), caused by construction of hydro-ingineering facilities, operations for land reclamation, dredging and underwater dumping. The study period includes past four decades for which airborne and satellite data are available. Results of using long-term RS data sets for monitoring and studying coastal water environment, for estimation of levels of water contamination by suspended matter (SM), for revealing spatiotemporal variability of SM distribution under the influence of natural and anthropogenic factors, for studying features of surface water dynamics and of phytoplankton development, are discussed.
remote sensing data, the Gulf of Finland, the Neva Bay, hydrotechnical constructions, dredging, dumping, suspended sediments, coastal water environment, contamination, anthropogenic impacts, dynamics of ecological state of aquatic system.
I. HISTORY OF USING REMOTE SENSING DATA FOR DETECTION ANTHROPOGENIC IMPACTS IN THE COASTAL AREA ANDER CONSIDERATION
Opportunities are discussed and examples are presented of applying the RS methods for obtaining additional knowledge for coastal area study and for detection and estimation of levels of anthropogenic impacts on the water environment affected by implementation of large projects – building of hydro-engineering facilities, construction of new ports, accompanied by large scale dredging operations and by underwater damping.
The RS data used for long-term monitoring of the NB and the EGOF were obtained from different platforms and different sensors of optical, thermal and microwave ranges of electromagnetic spectrum. At present RS technologies offer large amount of spatial information from variety of sensors with middle, high and ultra-high spatial resolution, operating in different ranges of electromagnetic spectrum. Suitable for our goals can be archival and recent satellite data from: RESURS-F, LANDSAT (http://glovis.usgs.gov/, http://earthexplorer.usgs.gov/), ADEOS/AVNIR, SPOT/HVR, IKONOS, QUICK BIRD, EROS, World View 2, Rapid Eye, EROS, RADARSAT, ENVISAT/ASAR, MODIS/Aqua, MODIS/Terra (from http://modis.gsfc.nasa.gov/MODIS) and other. Using RS methods we can update and create maps of the coastal and water environment of different scales: 1:200 000, 1:50000, 1:25000, 1: 10 000.
Investigations of the NB and EGOF on the basis of aerial and satellite data were started in early 1980’s. For interpretation of the RS data for water environment and for development of corresponding methods for qualitative and quantitative estimation of total suspended matter (TSM), the conventional in situ measurements of various parameters characterizing water masses, as well as data from hydro-meteorological network service and relevant regionally oriented knowledge (hydro-optical theoretical and applied research, spectral characteristics of different waters masses, features of water dynamics and so on) have been used. Techniques for estimation of concentrations of TSM in the upper water layer on the basis of RS images have been developed using field observations of TSM and/or relative transparency of water (Secchi depth), taking into account the regional regression relationship between water transparency and SM concentration [1, 2, 3].
Ambiguity perception while interpretation of satellite images of the water-atmosphere system (or of the bottom-water-atmosphere system, for the cases of shallow coastal areas with enough transparent waters) may be caused by optical inhomogeneities related to components of the aforementioned systems (due to atmosphere, bottom, water masses and surface water roughness). Possible misclassification in interpretation of optical inhomogeneities recorded in satellite imagery can be avoided by careful analyzing of multichannel RS data, using simultaneous in situ measurements of water characteristics and with knowledge data support.
Construction of the Flood Protection Facility of Saint Petersburg (briefly – the Flood Barrier, or the Dam) over the Southern and Northern Gates of the NB has started in 1979. Active construction began in July 1981. But in the early 1990’s, after 15 years of works, the construction was suspended, at that time approximately 40% of the construction works were completed [4]. It occurred due to coincidence of drastic political and economical changes in the country and the authoritative but incorrect conclusion, supported by public opinion, that namely the Flood Barrier was the main source of the poor ecological state of the NB. As a result, the financing of the Dam construction was stopped. The construction of the Flood Barrier was restarted only in early 2000’s and was completed in August 2011. During different periods of the Dam construction, the ratio of the flows through the Northern and the Southern Gates became 26% to 74%, 40% to 60% and 58% to 42%. Features of these changes can be identified and analyzed from RS images, due to the presence of sufficient quantity of SM for tracing water dynamics, see for example fig. 1. In the case examined the Northern Gates is almost closed.
During period of the first stage of the Dam construction, in coastal areas of the NB large scale hydro-engineering activities for land reclamation for future settlements were performed. This period was characterized by high and very high levels of water contamination by suspended sediments (SS) and also by concomitant pollutants (heavy metals, chlorine-organic matter and other) and by low water transparency depth, especially along of the NB coasts; the TSM concentrations reached up to 200-300 g/m3.
Initially, with taking into account a need for providing possibility for RS data from different sources processing and unification, only six clusters for discrimination of levels of contamination of water by SS was chosen. Under the assumption of horizontally homogeneous atmosphere, the classification was carried out using the value of radiance of water- atmosphere system.
For coastal waters with high level of concentrations of non-absorptive SS, such simplification was proved by results of modeling calculations for estimation of atmosphere contribution to the signal received from a satellite. On the basis of analytical calculations it was concluded, that for long-wave range of visible spectrum the contribution of atmosphere significantly decreased with increasing the concentrations of SS. For instance, the relative contribution of atmosphere falls down to 20% for SS concentration of 50 g/m3 under low atmospheric optical thickness conditions. For the case of “clean” seawater, in the same spectral range and for the same atmospheric condition the contribution of the atmosphere exceeds 90%.
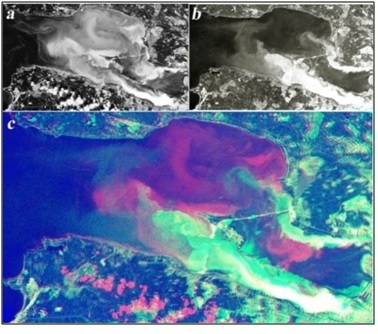
Fig. 1. Change of ratio of flows through Northern and Southern Gates of the NB and of water dynamics are seen from different time satellite images: a) Resource-F/KATE-200 – from 08.08.1986, with flows ratio of 26% to 74%; b) Resource-F/KFA-1000 – from 12.07.1989 with flow ratio of 58% to 42%; in both these images grey and white colors show the water areas (zones) contaminated by SM due to hydro-engineering operations for land reclamation in the NB coasts; the background waters are shown in black color; c) superposition of images: the red tones marked the 1986 year, the green tones – 1989; the red spot in the NB shows redirection of coastal water flow for the case study when the Northern Gates was almost closed.
On satellite images of the NB and the EGOF of the 1980’s years period, in accordance with the methods developed six water classes have been distinguished with the following ranges of TSM concentration, see fig.2: 1) lower than 10 g/m3 (for background relatively clean water); 2) 10 to 15 g/m3 (for water with very low level of contamination); 3) 15 to 20 g/m3 (for low level case); 4) 20 to 25 g/m3 (for mediate level); 5) 25 to 60 g/m3 (for high level); and 6) more than 60 or 100 g/m3 (very high level of water contamination), the last range corresponds to saturation effect for the commonly used spectral channels of visible spectral range [1, 4].
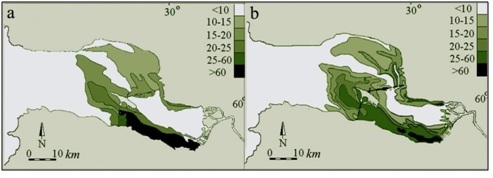
Fig.2. Schematic maps of distribution of SM concentrations (g/m3) in the NB and the EGOF, compiled from RS data. In both cases there are stable outflow hydro-meteorological situation, characterizing by low changeable winds and slow oscillations of the sea level: a) satellite image from Cosmos-1939/MSU-SC from 01.07.1989; b) airborne observations from 30.07.1989.
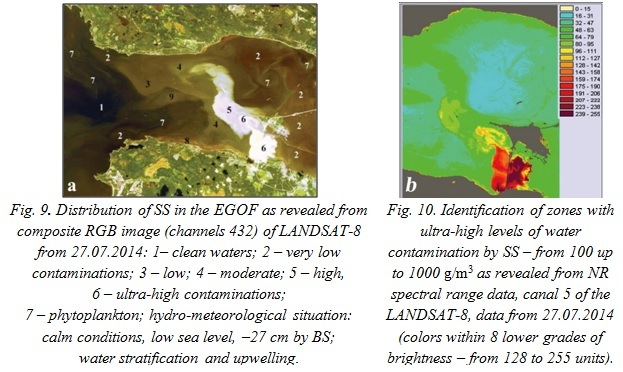
Also a method was developed for detection and examination from RS images of the areas with ultra-high levels of water contamination, from more than 100 g/m3 and up to 1000 g/m3 (and more) of SM concentrations [2, 5]. The approach for developing the method is based on spectral features of the radiances for waters with ultra-high levels of TSM concentrations case in the near infrared (NI) spectral range.
In the NI range of spectrum the zones with ultra-high level of SS contamination can be classified in order to reveal a number of clusters in the examined “hot spot”. In the article [6] authors revealed the linear correlation between water radiance registered in NI range of spectrum and variability of SS concentrations from 100 to 3000 g/m3. For implementation of this method the channel 5 of LANDSAT-8/OLI, situated at the spectrum range of 851 to 879 nm range, is suitable. The example of using this method is presented below in chapter II of the article.
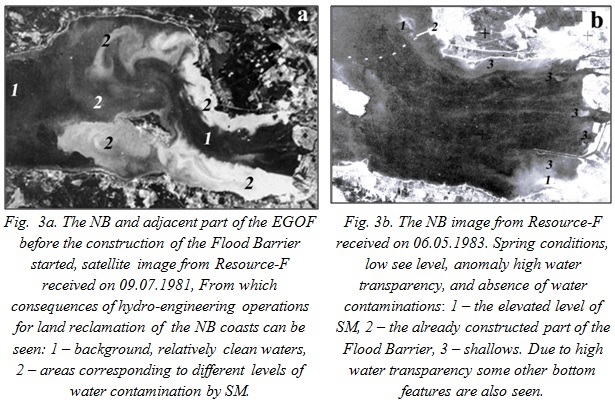
Thus, due to land reclamation operations, during more than three decades, beginning from the end of the 1960th’s till the early 1990th years, the presence of water zones with high and very high levels of SS concentration became the almost permanent peculiarity of the NB and the neighboring part of the EGOF [1, 3], see fig.1, 2 and 3a. The appearance of the NB in the case of absence of water contaminations caused by SM produced by the land reclamation activity can be seen on fig.3b.
The waters from the NB flow to the EGOF through the Northern and Southern Gates that are separated by the Kotlin Island, these gates were 9 to10 and 5 to
The mean annual inflow from the Neva River is 2500 m3/s. Flow velocities in the main, transit water, area of the NB vary from a few to some 10 cm/s, with higher values in navigation channels. The shallow zones along the northern and southern coasts are characterized by slow water circulation with velocities of about 2 cm/s. The water movement features of the NB often are well reflected in RS images due to presence of nature and anthropogenic tracers, such as phytoplankton, temperature, SS.
From long-term RS data sets it becomes possible to analyze the spatiotemporal variability of hydro-physical fields, traced by SM. For fields of SM distribution in the NB and the EGOF the variability of seasonal and synoptic scales was revealed [3]. Peculiarities of water dynamics in the area under consideration for different types of hydro-meteorological situations and also for some periods of construction of the Flood Barrier were examined [1, 3], see for example fig.1.
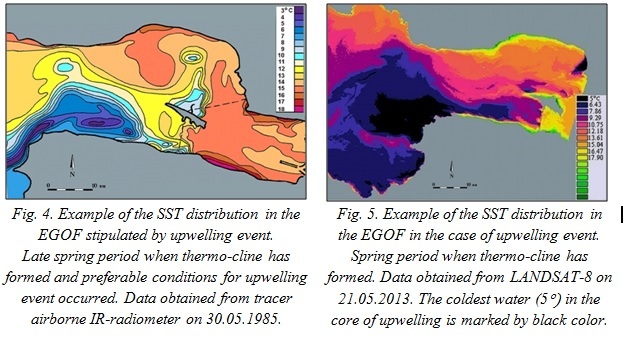
From the fig. 4 the pattern of sea surface temperature (SST) distribution in the EGOF can be seen, the case related to the spring-summer period when thermo-cline has formed and upwelling event occurs. This schematic map was compiled using observations obtained from tracer airborne IR-radiometer on 30.05.1985. On the next image one can see the upwelling situation registered from band 10 of IR-thermal radiometer of LANDSAT-8 on May 21st 2013, see fig. 5. Satellite data were processed, land was masked and 10 main classes of the SST were determined. Calibrations of RS thermal data were made using in situ measurements of sea water temperature, provided by the Northern-Western Hydro-meteorological Survey.
In the whole, during the above examined 40-years period (that belongs mainly to the past century) in the NB and the EGOF the following large projects were implemented: 1) the aforementioned operations for land reclamation of future urban territories in the coastal areas of the NB – a period from the end of 1960’s till the early 1990’s years; 2) the first stage of the Flood Protection Barrier of Saint Petersburg construction (1979 to 1989).
As a result of our study conducted on the basis of RS data can be marked that the ecological state of the NB and the EGOF for the examined four decades can be divided in two periods. The first one lasted since the middle 1970’s till the early 1990’s, when large scale operations for land reclamation of urban territories were being conducted in the shallows of the NB. The second period begins from the early 1990’s and goes on till early 2000’s; this coincides with the crisis in agriculture and industry; at the same time the activity for the land reclamation in the NB was cancelled. As a result, considerable amelioration of ecological situation and improving of waters quality parameters were observed in due course.
II SATELLITE MONITORING OF ANTHROPOGENIC IMPACTS
ON THE AREA UNDER CONSIDARATION IN THE XXI CENTURY
A new stage of essential anthropogenic impacts of hydro-technical facilities building and dredging operations on the coastal and water environment of the NB and EGOF began in the early 2000’s: the next stage of the Flood Barrier construction after interruption (restarted in 2003 and finished in 2011); the construction of the port of Ust’-Luga started in 2003; the large Sea Façade of Saint-Petersburg project realized in the years 2005 to 2008, with more active phase of dredging in 2006 to 2007; the large project for construction of a multipurpose maritime transshipment port complex (MMTPC) of Bronka, the period of implementation being 2011 to 2015, the more active dredging activity was observed from 2013 to 2015 years.
In the nearest future realization of new projects, related with large scales of the land reclamation and dredging operations in the NB and the EGOF, are expected. Namely, in the framework of building a port complex in vicinity of the town of Lomonosov the initially planned dredging volume reaches 17 000 000 m3, and 4 000 000 m3 – for the future port of Kronstadt. Before 2021 a large amount of land reclamation activity in the NB and the EGOF is planned: 244 ha in the NB before the Vasilevsky Island, 370 ha near the coast of the Sestroretsk, 186 ha for the Bronka port and 79 ha for the coastal area nearby the Lomonosov. As for the largest project of the Sea Façade, about 170 ha is realized up to now from the planned 414 ha, so 244 ha remain for future hydro-engineering works [7]. Of course, significant anthropogenic impact on the aquatic system is to be expected due to the implementation of each of this project, as well as due to their integrative effect.
It must be noted that the technologies used for dredging in the framework of large projects which began in this century, as compared with those used in the last century, become more powerful and advanced, so more dangerous for water and for coastal environment. Especially, if dumping of ground is done directly in the shallow estuary as it happened during dredging works in the NB within the “Sea Façade” project.
Volumes of dredging and scales of water pollution of the NB and the EGOF identified from RS images from 2006 to 2007, during more intensive dredging operations and ground dumping directly to the NB (see fig. 6), exceed the ones observed earlier [8, 9], caused by land reclamation for creation of new urban territories during the 1970s to 1980s years (see chapter I fig. 1, 2, 3a). Dredging and ground disposal to the NB of more than 20 million m3 of the bottom deposits have produced the high level of fine-grained suspension and high water turbidity on the large area. This suspension easily adsorbs polluting substances from water and transfers those far away to the EGOF [8].
Both in 2006 and in 2007, along all the coast of the Kurortny District, during all the period of supervision, extensive zones with high and very high levels of water contamination by fine-grained SS were permanently detected. These zones are characterized by very low values of a relative water transparency and also with very limited (to several cm) photic zone. As it can be seen from satellite images, substantial increase of anthropogenic loading on the EGOF started from June 2006 and was provoked by large scale bottom-dredging activity carried out in the NB, connected with the implementation of the Sea Façade of the St.-Petersburg project [8, 9].
Examples of SS distribution in the area under consideration in the circumstances of seasonal cooling and mixing of water masses and while the dredging activity in the NB was interrupted are presented in fig.7.
Analysis of the literature sources [10, 11] and of the results, obtained from continuous RS monitoring of the area under consideration, allow us to conclude that for such kind of fine sediments, namely the glacier-lake sediment, which were excavated during the 2006 and 2007 years from the bottom of the NB by intensive dredging operations and also dumped to the estuary, particulate materials can spreading to large distances and can stay in suspension for a relatively long time (up to two months) even in conditions of seasonal cooling and mixing of water masses, see fig. 6 b, c, d and fig.7.
.jpg)
Fig. 6. Examples of water contaminations by fine SS as registered from the MODIS sensor. The situations differ by intensity of hydro-engineering activity, by the way and place of ground disposals, as well as by hydro-meteorological conditions: a) image from 29.10.2005;
b) from 21.09.2006, c) from 30.09.2007, d) from 31.07.2008. In the 2005 and 2007 years, hydro-engineering works were also executed in the southern part of the Flood Barrier.
It is obvious that the dredging for bottom deepening can be considered as the main source of the intensive water contamination by SS during the realization of the Sea Façade project. Thus the volumes of bottom deepening for creation of Petrovskiy seaway and a new channel for passenger terminal in the NB were: 1 230 000 m3 in the year 2005, 12 150 000 m3 2006, and more than 8 000 000 m3 in 2007.
From analyzing long-term series of satellite images it can be seen that in the period of the greatest anthropogenic impact (the period of 2006 and 2007) a large part of investigated aquatic system was influenced by intensive dredging activity.
.jpg)
Fig. 7. Examples of water contamination of the EGOF by fine SS during implementation of the Sea Façade project, registered from the MODIS sensor: a) image from 24.11.2007 – the late autumn aspect, distribution of SM after the dredging activity in the NB was interrupted; b) image from 02.01.2008 – the winter aspect, after six weeks passing; in spite of the time passed, a sufficient amount of sediments in suspension can be seen.
After four years elapsed from the first stage of the Sea Façade project implementation, the new large project mentioned above the MMTPC Bronka project, started in the NB and EGOF, the most active dredging activity was observed in the years 2013 to 2015. On the whole, the planned volume of dredging for the Bronka project is estimated by 29 300 000 м3 and it exceeds the total volume of dredging works executed in the framework of the Sea Façade project (21 880 000 m3).
It must be noted that considerable sources of water contamination by SS were not revealed from satellite monitoring data for the NB and the EGOF during the four year period of 2009 to 2013, characterized by low hydro-engineering activity in the area under consideration.
However, increased levels of water turbidity in the NB and in the EGOF, behind the Dam, often can be observed. These features are caused by action of natural (hydro-meteorological) factors that induced in the shallow areas secondary contamination of water by SS due to re-suspension of none-consolidated silt layer of bottom sediments that was formed during the period with intensive dredging and dumping (the years 2006 and 2007), for details see [5].
For the MMTPC Bronka project construction hydro-engineering works have been conducted in the south-western part of the NB. Scenarios of the distribution of SS in the EGOF have been defined by the dredging and dumping intensity and by hydro-meteorological conditions. The water stratification and upwelling events often re-display and even partially re-direct the contaminated by SS water masses to the northern coast of the EGOF, see fig.8. In such situations the coastal waters’ quality of the Resort District of St. Saint-Petersburg deteriorates.
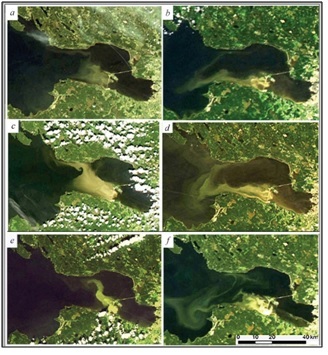
Fig. 8. Scenarios of SS distribution in EGOF under the influence of natural and anthropogenic factors revealed from MODIS images: the Bronka port construction is going on in the south-eastern part of the NB: a) 15.05.2014, calm weather, sea level –8 cm by BS, stratification and upwelling can be observed; b) 15.06.2014, decreasing sea level situation, NE winds; c) 27.07.2014 intensification of dredging activity, water stratification, upwelling, NW winds, high level of SS can be detected even along the northern coast of EGOF; d) 11.07.2014, stratification, NE winds3-4 m/sec, low sea level (–15 cm by BS); e) 27.07.2014, stratification, upwelling, calm weather, low sea level (–27 cm by BS); f) 16.09.2014, stratification, upwelling, NE winds.
However, analysis of results of regular satellite monitoring of the NB and the EGOF conducted during 2013-2015 years shows that the largest anthropogenic impact stipulated by dredging operations can be observed near the southern coast along both sides of the Dam. Here ultra-high levels of water contamination by SS, with concentrations up to 1000 g/m3, can be detected, for example see fig. 9, 10. Method for detection and analysis of such a “hot spot” is shortly described in chapter I of the paper and in the article [12]. The RS methods for studying elements of ecological state of water objects are based on an integrated approach to the analysis of RS multi-spectral images, different kinds of conventional in-situ measurements, cartographic materials and knowledge data as well.
III CONCLUSION
Analysis of results of long-term RS monitoring of the NB and the EGOF allows us to make the conclusion that the spatial scales and intensities of anthropogenic impacts on coastal and water environments due to implementation of large projects in the current century are very large. Observed levels of water contamination by SS exceed those for earlier impacts in the past century (1970’s and 1980’s years). During a large time period of the year 2006 (the Sea Façade project case) a disposal of extracted sediments occurred into the transit zone of the NB, so the outward propagation of fine SS can be detected in satellite images on the large areas of the EGOF and up to 180-200 km from the sources of contamination. In our opinion, it is necessary to take urgent measures for environmental protection and prevention of further worsening of the ecological state of the NB and the EGOF. Ecological Monitoring/Audit during the entire period of performing the hydro-engineering activities must be carried out properly and be objective, furthermore, ecological audit must be independent (firstly of all, independent from the customer of works).
IV NOTES
Beginning from the period of the years 2012 to 2014, the investigations were carried out in the framework of the TOPCONS project – Trans-boundary tools for spatial planning and conservation of the Gulf of Finland, Grant N 2011-022-SE511. The main objectives of the Finnish-Russian trans-boundary interdisciplinary TOPCONS project, funded by ENPI-CBC programme were to create an information background, methodology and tools for spatial planning in the EGOF [5, 12].
1. L. Sukhacheva. S. Victorov. “Remotely Sensed and Conventional Data Fusin for Investigation of Spatial and Temporal Variability of Hydro-physical Fields in the Neva Bay and the Eastern Part of the Gulf of Finland.” Proceedings of the First Australian “Data Fusion Symposium,” Adelaide, Australia, 21 - 22 November 1996, pp. 131-134.
2. L. Sukhacheva. “Estimation of variability of the sea spectral radiation values on top of atmosphere border for cases of surface waters with increasing concentrations of non-absorptive suspended matter.” Remote sensing of the Earth and atmosphere using aerospace methods. Proceedings of the all-Russian Scientific Conference, Murom, 2001, pp. 379-382, (in Russian).
3. L. Sukhacheva. “Multi-scale Space-Time Variability of the Distribution of the Fields of Suspended Matter in the Eastern Part of the Gulf of Finland Based on Data from Aerospace Observation over Several Years.” Earth Obs. Rem. Sens., 1997, Vol. 14, pp. 793-804. (Suhacheva L. L. “Issledovanie raznomasshtabnoy prostranstvenno-vremennoy izmenchivosti poley vzvesi v vostochnoy chasti Finskogo zaliva po dannym mnogoletnih aerokosmicheskih nablyudeniy”. Issledovanie zemli iz kosmosa, No 5, 1996, c. 85-93.)
4. Newspaper “Saint-Petersburg lists”. Issue 186, 03.10.2014, [Online]. Available: http://old.spbvedomosti.ru/guest.htm?id=10310946@SV_Guest [Accessed: 11-May-2016].
5. L. Sukhacheva, M. Orlova. “Satellite Methods in Assessment of Technogenic Impacts on the Eastern Gulf of Finland by the Example of the Seaport Complex Bronka construction.” Journal “Regional Ecology.” No 4 (39), St. Petersburg, № 2(39). 2015, pp. 67- 83, (in Russian).
6. Hudson S. J., Moore G. F., Bale A. J. et al. “An operational approach to determining suspended sediment distribution in the Humber estuary by airborne multispectral imagery,” Proceeding of the First International Airborne Remote Sensing Conference and exhibition. Strasbourg, France, 1994, vol.3, pp. 10-20.
7. O. Korneev. “To avoid water turbidity” - interview from I. Yushkovskaia Newspaper “Saint-Petersburg lists”. 06.11.2015, (in Russian) [Online]. Available: http://spbvedomosti.ru/news/gost_redaktsii/oleg_korneev/ [Accessed: 11-May-2016].
8. Usanov B.P., Victorov S.V, Sukhacheva L.L. New “Impact” on the Neva Bay. Journal “The transport of the Russian Federation”. No 3-4, 2008, (in Russian).
9. L. Sukhacheva. “The relevance of satellite environmental monitoring of Neva Bay and the eastern Gulf of Finland in the conditions of anthropogenic impact increase on the water area.” Materials of the scientific conference SPSU dedicated to the "Year of the Gulf of Finland - 2014", 16 February 2012, St. Petersburg, 2012, pp. 247-252, (in Russian).
10. Literature review of effects of re-suspended sediments due to dredging operations. Prepared for Los Angeles Contaminated Sediments Task Force Los Angeles, California. Prepared by Anchor Environmental C.A. L.P. One Park Plaza, Suite 600 Irvine, California 92614, June 2003, p. 85.
11. Rybalko A.E., Fedorova N.K., Maximov A.A. Influence of hydraulic engineering work on forming of geochemical structure of bottom sediment (the Eastern Gulf of Finland in 2006-2008). Geology of seas and oceans: Reports collection of XVIII International Scientific Conference for Marine Geology, Volume IV. Moscow. GEOS. 2009, pp.147-149, (in Russian).
12. Sukhacheva L. L., Orlova M. I. About application of the results of satellite observations in the eastern Gulf of Finland for the assessment of natural and men-mediated impacts onto ecological state of the aquatic area and biotic components of the ecosystem. Journal “Regional Ecology,” № 1-2 (35), 2014, pp. 62-76, (in Russian).