


Russian Federation
BISAC NAT010000 Ecology
BISAC NAT045050 Ecosystems & Habitats / Coastal Regions & Shorelines
BISAC NAT025000 Ecosystems & Habitats / Oceans & Seas
BISAC NAT045030 Ecosystems & Habitats / Polar Regions
BISAC SCI081000 Earth Sciences / Hydrology
BISAC SCI092000 Global Warming & Climate Change
BISAC SCI020000 Life Sciences / Ecology
BISAC SCI039000 Life Sciences / Marine Biology
BISAC SOC053000 Regional Studies
BISAC TEC060000 Marine & Naval
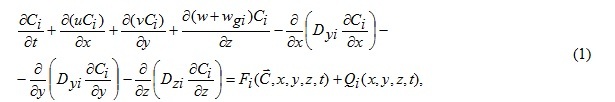
The problems appeared during development and calibration of one-dimensional (vertical resolution) biogeochemical block of water quality model, are discussed. It is extremely useful in the initial stage of shelf ecosystems research because of its simplicity in as implementation as result interpretation. To describe the environmental parameters dynamics we used the Model for Estuarine and Coastal Circulation Assessment, which consists of hydrodynamic model; model of conservative impurity transport; chemical and biological model. The seasonal of biogenic elements and phytoplankton variability in the Sevastopol Bay is studied as an example.
biogeochemical modeling, biogenic elements, phytoplankton, optimization methods, Sevastopol Bay.
I. Introduction
The problems of semi-closed impact water basins are the most relevant because of increasing anthropogenic pressure. The consequence of this impact may lead to a significant reduction in the water quality of shelf ecosystems. In this regard, it needs to study the current state, the dynamic of degradation and the possibility of water quality enhancement. The creation of ecosystem models can reflect the current understanding of the major mechanisms that determine the peculiarity of the real ecosystems functioning. The model gives opportunity to evaluate the interactions that occur in real systems, but are not amenable to direct measurement. In addition we may assess the feasibility of certain results of in situ simulation.
The creation of a mathematical model is as a rule preceded by an environmental monitoring of the ecosystem under study. The environmental monitoring program can be optimized based on the simulation results. Using a mathematical model, it is possible to give evidence-based practical recommendations how the economic or environmental projects may be implemented, while minimizing the requirements for the cost of environmental monitoring.
One of the sources of data for environmental monitoring is the remote sensing images. The modern space radar survey is the most effective way to solve the problem of pollution monitoring, because of it all-weather, regardless of light conditions and high resolution. An advantage of remote measurement consists in a possibility of continuous determination of mean concentration of pollutions in area (as opposed to ground survey, which gives a concentration only in one point), and in an estimation of the horisontal distribution of impurities, characterizing the potential of contaminant.
The purpose of study is to demonstrate the potential and prospects of the use of mathematical models of water dynamics, self-purification and eutrophication to solve the environmental problems in the
The Sevastopol Bay has been widely used in different spheres of national economy for over two centuries. The bay is a harbor for military and commercial ships. On its shores, the
(the depths are denoted in meters).
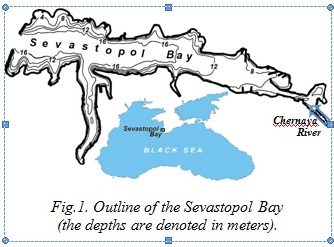
historic part of the city of Sevastopol is located, as well as industrial enterprises (ship repair and ship building, tank farms, power plants, etc.). In the bay, there are more than 30 wastewater outlets, both temporary and permanent, which flow from 10 to 15 thousand m3 of wastewater per day [1]. The different pollutions get in the
II. MODEL FRAMEWORK
To predict the dynamics of the environmental parameters the water quality model МЕССА (Model for Estuarine and Coastal Circulation Assessment) [2] was used. In this work, we modeled the annual dynamics of phytoplankton, organic phosphorus, phosphate phosphorus, organic nitrogen, ammonium nitrogen in the
- a hydrodynamic model, which describes water dynamics in the surveyed area under different hydro-meteorological conditions and takes into account morphological characteristics of the basin (bathymetry, coast configuration);
- a unit of transportation of conservative, passive admixtures, which represents a numerical implementation of the equation
Hydrodynamics
The proposed model makes it possible to calculate three-dimensional thermohaline structure of the waters, intensity of turbulent exchange, as well as wind (drift and compensative), density, gravity and tidal currents in estuaries, bays and on a shallow continental shelf. The characteristic feature of this model is making simultaneous calculations of water dynamics and substance distribution to the area of the adjoint water bodies under both the grid and the subgrid scales. In this case bays and sea shelf areas, spatial dimensions of which substantially exceed a computational grid mesh of the numerical model are considered the water bodies of the grid scale. The subgrid water bodies have the width in one of horizontal directions which is considerably less than the computational grid mesh (e.g., narrow rivers, canals, channels).
The model is based on the complete system of hydrothermodynamic equations in the Boussinesq approximation and the approximations of incompressibility and hydrostatics. The system includes the equations of motion for the horizontal components of the vector of current velocity, the equations of hydrostatic approximation, the continuity equation, the equation of state, and the equations of conservation of heat and salt. The model is implemented in curvilinear (in the vertical direction) coordinates (σ-system).
The finite-difference approximation of the equations of heat and salt transfer in the original version of the MECCA model is realized by using the traditional algorithms of the numerical solution (by using simple approximations of the derivatives) [3].
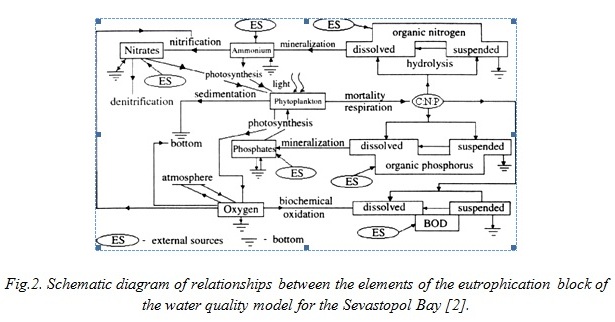
Biochemical processes
When constructing a numerical model of an aquatic ecosystem, three-dimensional space is usually divided into cells (boxes) corresponding to the grid boxes of the hydrodynamic unit. It is believed that inside the box, the elements of the ecosystem are linked only by the local fluxes of matter and energy, while movement of matter and energy between the cells occurs due to hydrodynamic transfer. As a rule, proper active movements of individual biological components of the ecosystem (e.g., fish) in the model are not taken into account [2].
The main processes considered in the chemical-biological unit of the complex models of aquatic ecosystems functioning are:
- removal of biogenic elements and primary production of organic matter during photosynthesis;
- nutrition of living organisms-consumers, food assimilation, spending on vital functions;
- formation of suspended sediment and dissolved dead organic matter as waste products, autolysis;
- mineralization of dead organic matter and regeneration of biogenic elements;
- nitrification and denitrification; mass transfer and gas exchange with bottom sediments and the atmosphere.
The biogeochemical unit includes description of dynamics of the following ecological variables at a local point in space: phytoplankton biomass, benthic macrophyte biomass, refractory particulate and dissolved organic phosphorus, labile particulate and dissolved organic phosphorus, dissolved inorganic phosphorus, refractory particulate and dissolved organic nitrogen, labile particulate and dissolved organic nitrogen, ammonia nitrogen, nitrite and nitrate nitrogen, refractory particulate and dissolved parts of the carbonaceous biochemical oxygen demand, labile particulate and dissolved parts of the carbonaceous biochemical oxygen demand, and dissolved oxygen. The conceptual diagram for the ecosystem model is shown in Fig.2.
Numerical method of calibration
Since the mismatch between the data calculated by the model and in situ data is relatively large, we used optimization method. Design of technical objects always includes elements of optimization because of the desire to get the best one among the possible options. This desire is realized by sorting the variants of the object structure (structural synthesis) and variation of parameter values of the object with a given structure (parametric optimization or simply optimization).
The inner parameters of the design object will be denoted as an n-dimensional vector X = (x1,…, xn), output parameters as an m-dimensional vector Y = (y1,…, ym), and outer parameters (environment parameters, values of specific speeds and ratios) as an l-dimensional vector P = (p1,…, pl).
Thus, in the most general form, the model of eutrophication unit can be set as follows:
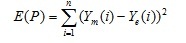
In order to find the set of P parameters, which will bring the lot of the simulated data {Ym} to the set of experimental data {Ye}, it is necessary to minimize the value:
In this paper, we use Hooke-Jeeves method (Pattern search) [4]. It is a method of direct search of the minimum of a functional. It consists of a sequence of steps of explorative search around the base point, which, if successful, is followed by the search according to the model.
The search procedure is the following:
- Select an initial base point b1 and a step with the length hj for each variable xj,
j = 1,…, n. - Calculate f(x) at the base point b1 in order to obtain the information about the local behavior of the function f(x). This information will be used to find a suitable search direction according to the pattern by which we can hope to achieve more descending values of the function. The function f(x) at the base point b1 is found as follows:
- Calculate the value of the function f(b1) in the base point b1.
- Each variable in turn is modified by the adding the step length. Thus, we calculate the value of the function f(b1 + h1e1), where e1 is the unit vector in the direction of the x1 axis. If this leads to the decrease in the value function, then b1 is replaced by (b1 + h1e1). Otherwise, we calculate the function value f(b1 – h1e1), and if its value decreases, then we replace it by b1 – h1e1. If none of the above reduces the value of the function, then b1 point remains unchanged and changes in the direction of the x2 axis are discussed, i.e., the value of the function f(b1 + h2e2), etc. is found. When all n variables are considered, we will have a new base point b2.
- If b2 = b1, i.e., the function decrease has not been reached, then the study is repeated around the same base points b1, but with a reduced step length. In action, the reduction of a step (steps) by ten times from the initial length is considered satisfactory.
- If b2 ≠ b1, then search according to the pattern is performed.
- When searching according to the pattern information obtained during research is used and minimization of the function is completed by the search in the direction specified by the pattern. This procedure goes as follows:
- It is reasonable to move from the base point b2 in the direction b2 – b1, because the search in this direction has already led to a decrease in the function value. So we will evaluate the function at the point of the pattern P1 = b1 + 2(b2 – b1). In the general case Pi = bi + 2(bi + 1 – bi).
- Then the study should continue around the point P1 (Pi).
- If the smallest value in step 3(b) is less than the value at the base point b2 (in general case bi+1), then we get a new base point b3 (bi+2) and after that repeat step 3(a). Otherwise, do not search according to the pattern from point b2 (bi+1) and continue the research at the point b2 (bi+1).
- Complete this process when the step length (the length of the steps) is reduced to the specified small value.
The equations of the eutrophication unit of the model include the parameters (specific speeds of chemical and biological processes) and the coefficients in the empirical equations describing variability of the values of these parameters depending on the characteristics of the environment and external factors. The sensitivity of the model to the variations of its parameters and the parameters of external loading is analyzed. This study is performed for each parameter pl separately and is based on the fact that the range of possible variations of a parameter is established in the stage of precalibration or in the course of special experiments. Further, by varying the most sensitive parameters within the possible range of their variability, we make an attempt to achieve maximum compliance of the model results with observational data, using the minimization of the sum of squared deviations of the data calculated by the model and in situ data.
III. Simulation of the Sevastopol Bay
Initial and boundary conditions
During adaptation of the thermohydrodynamic model to the conditions of the Sevastopol Bay and its verification data from field observations of hydrological characteristics of the bay waters (temperature, salinity, water level), the average discharge of the Chernaya River water (2.3 m3/s at the flow rate of 0.2 m/s), and the data of water level in the bay at the Pavlovsky Cape, located in the centre of the bay were used.
In addition, data on weather conditions (air temperature, wind speed and direction, photosynthetically active radiation, average monthly data on moisture and amount of clouds, etc.) were used as boundary conditions.
We also used annual variations of transparency, averaged over 2001 – 2005, the initial values of seawater temperature, salinity, concentrations of phytoplankton, biogenic elements, oxygen, organic phosphorus and organic nitrogen, averaged over 2001 – 2005, which are set for January 1 of the target year.
In the course of calculations the Sevastopol Bay water area was discretized by a horizontal calculation grid of 47 ´ 97 nodes with the mesh cell width of 80 m. Six calculation levels were used along the vertical in s-coordinate system. A time step was 3 s for the barotropic constituent of the current velocity and 18 s – for the baroclinic one. Calculations of the steady wind flows were carried out under stationary winds of eight basic rhumbs of 5 m/s speed.
Model calibration
Using the results of the study on the sensitivity of eutrophication model, described in [2], the most sensitive parameters were determined, and the calibration of 1-dimensional version of MECCA model was carried out. The final parameter values are given in Table 1.
Table 1. Values of parameters for the chemical-and-biological block of the eutrophication model of the Sevastopol Bay determine as a result of its calibration
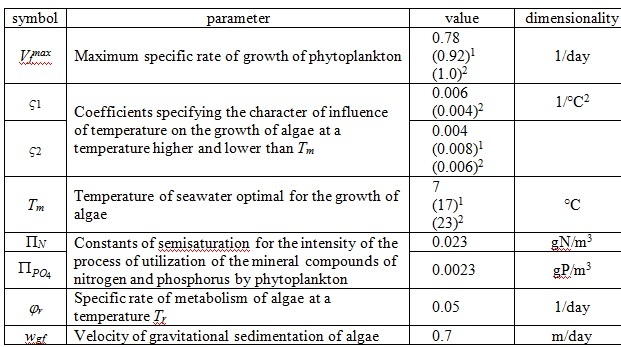
Comment: index «1» indicates on from 46 to 198 day of computed year; index «2» – from 199 to 290 day of computed year.
Results and Discussion
The calibrated model was applied to simulate the eutrophication processes in the Sevastopol Bay during 2001 – 2005. Figure 3 shows the annual dynamics of the main elements of the ecosystem covering surface waters of the Bay of Sevastopol. The curve line corresponds to the data calculated by the model, points denote in situ data, which were averaged for 2001 – 2005 and the standard error. Although there were some differences between measurement and simulation, trends and quantities of parameters obtained from the model were generally in agreement with the observations.
.jpg)
The accumulated numerical results show that the model correctly describes the annual course of temperature in the surface layer of waters (Fig.3, a). We reveal certain distinctions between the numerical results and in situ data. Indeed, in summer, the computed temperature of the surface layer exceeds, in numerous cases, the observed values of temperature by several degrees. Moreover, in spring and summer, the bottom layer is heated slower than it follows from in situ data. However, these disagreements are, to a significant extent, caused by the elimination of the contribution of horizontal advection of waters to the heat exchange between the surface and bottom water (due to the surge phenomena).
The series of numerical experiments carried out with the three-dimensional version of the model is aimed at the analysis of variations of the three-dimensional thermohaline structure of waters and the current patterns under constant wind conditions.
We consider the synoptic situation, when the wind does not change for several days, and the flow can be considered as a stationary. It was revealed that in the surface layer the direct flow from the Bay is formed under the influence of east wind; it is also retained at the north and south winds. It can explain by the bay orientation and morphometry. In addition fresh water entering the top of bay creates slope of the water surface and causes stock current. In the bottom layer pattern is identical for all wind direction: flow is directed to the bay through the strait and is maintained throughout the length of the bay, in the shallow areas there are all sorts of circulation formation.
For biological study of shelf ecosystems the distribution of phytoplankton biomass is a significant indicator as primary productivity of phytoplankton is a constituent part of food chain. Any changes in the rate of development of phytoplankton communities affect the vital processes in the marine ecosystem as a whole. That is why in modeling ecosystem Sevastopol Bay the first step is a simulation of phytoplankton.
The calculations carried out using the one-dimensional version of the model show that after calibration the model gives good results on phytoplankton (Fig.3, b). The maximums of biomasses are observed spring and fall, which coincides with the in situ data. The October maximum of in situ is explained by "bloom" of large diatom Cerataulina pelagica (Cl.) Hend and Nitzschia tenuirostris Gran [5].
It is also clear that the model gives good results on biogenic elements (Fig.3, c – e). Biogens are the material basis of biotic cycle and a leading factor in the eutrophication of water basin. In the Sevastopol Bay water the content of phosphate, ammonium, nitrate and nitrite is directly dependent on the sources of inflow (a river and storm water, a municipal and industrial wastewater and so on), as well as on the degree of its involvement in the biological processes. The maximum content of biogens occurs in the winter and autumn, when its consumption by phytoplankton decreases sharply, and the processes of organic matter destruction and of biogens release are delayed. However, the model data on organic nitrogen and phosphorus (Fig.3, f – g) are underestimated because of the lack of in situ data and also because that in situ data were only taken from one station near the mussel farm, located at the bay exit.
The seasonal distribution of oxygen in the bay is defined by two major natural factors: climate (temperature and water dynamics) and biological. The surface layers are substantially saturated with oxygen. The correlation of temperature and oxygen is traced; because under high water temperature the intensity of oxidation processes increases and the oxygen solubility decreases (Fig.3, h).
The results of the calibration of one-dimensional version of the model allow to use the set of empirical coefficients in the three-dimensional version of the model.
IV. Conclusions
The study developed the water quality model, which coupled a 1-D biochemical module and a 3-D hydrodynamics module. The influences of relevant hydrological conditions, external pollution loads, wind, solar radiation, water temperature were considered in the model. After sensitivity analysis and calibration, the model was applied to the Sevastopol Bay. The comparisons between model results and in situ data in 2001 – 2005 indicated that the model is able to simulate the eutrophication dynamics in the Sevastopol Bay with a reasonable accuracy.
Modeling of biogeochemical processes involving natural and anthropogenic substances is vital for assessing the condition of marine ecosystems. The results given in this paper show that the use of the optimization method of Hooke-Jeeves allows us to represent real annual dynamics of phytoplankton biomass, organic nitrogen and phosphorus, phosphate-phosphorus, nitrogen ammonium nitrogen nitrates and nitrites more accurately. The obtained results confirm the feasibility of using optimization methods in biogeochemical modeling and provide an opportunity to continue using three-dimensional modeling.
Mathematical models are an effective tool for predicting the consequence of anthropogenic impact on the environmental system state, its functioning and structure (results of fishing, pollution, changes in river runoff, hydraulic engineering, etc.). The forecasts of trends in ecosystem state, obtained by the simulation results, allow taking into account the likely consequences of any economic activity and seeking science-based variation of the nature-conservative measures. Thus, mathematical models are the link between ecological theory, research and management.
River
1. V.A. Ivanov, Ye.I. Ovsyanii, L.N. Repetin, A.S. Romanov, and O.G. Ignatyeva, Hydrological and hydrochemical regime of the Sevastopol Bay and its changes under the influence of climatic and anthropogenic factors. Sevastopol: ECOSY-Hydrophysics, 2006. 90 p. (in Russian)
2. V.A. Ivanov, and Yu.S. Tuchkovenko, Applied mathematical water-quality modeling of shelf marine ecosystems. Sevastopol: ECOSY-Hydrophysics, 2008. 311 p.
3. K.W. Hess, MECCA Programs documentation: Technical Report. Washington, D.C., NOAA. NESDIS 46, 1989. 97 p.
4. B. Bunday, Basic optimization methods. Publ. by Edward Arnold, 1984. 128 p.
5. O.A. Lopukhina, and L.A. Manzhos, “Phytoplankton of the Sevastopol Bay (the Black Sea) in warm and cold periods 2001-2002” // Marine ecology. 69, pp.25-31, 2005. (in Russian)