


BISAC NAT010000 Ecology
BISAC NAT045050 Ecosystems & Habitats / Coastal Regions & Shorelines
BISAC NAT025000 Ecosystems & Habitats / Oceans & Seas
BISAC NAT045030 Ecosystems & Habitats / Polar Regions
BISAC SCI081000 Earth Sciences / Hydrology
BISAC SCI092000 Global Warming & Climate Change
BISAC SCI020000 Life Sciences / Ecology
BISAC SCI039000 Life Sciences / Marine Biology
BISAC SOC053000 Regional Studies
BISAC TEC060000 Marine & Naval
An overview of modern approaches to the problem of parametrisation of sources of marine waters microplastics pollution from the coastline is conducted. The estimates of Europe’s plastic production along with mismanaged plastic waste percentage that might be the source of microplastics particles input to marine environment are presented. A semi-empirical for-mulation for the particles source intensity is suggested. It considers the main factors of local anthropogenic pressure for the coastal spot location for the given coordinates. Both ad-vantages and disadvantages of such an approach along with possible ways for improvement are discussed.
microplastics, numerical modelling, the Baltic Sea, anthropogenic pollution
I. Introduction.
Numerical simulation of environmental processes is always a challenging problem: with all our knowledge we are certainly unable to embrace all the forcing, processes and events in both natural environment and human activity. Thus, the necessity of parametrisation of many of them arises, and every parametrisation is supposed to express the influence of some key factor but in the most simple (i.e. – practically convenient) way. This balance of importance versus model simplicity is always problem-specific and highly dependent on the goal of the simulation, that leads to the development of plenty of model approaches, particular parametrisations, input/output parameters, etc.
In modelling of microplastic pollution of seas and oceans, the most complicated question for today is how to describe coastal sources of microplastic particles. While sources of plastic macro-litter can be associated with cities, popular beaches, or ports, the generation of microplastic particles involves many physically complicated environmental processes like UV-degradation, mechanical destruction in swash zone, settling and re-distribution by currents, re-suspension/re-deposition by storm waves, etc. Which of these processes must be taken into account and how to parametrise them – is a hot question, still practically not discussed in literature.
According to existing naming conventions, the microplastic is the particles of synthetic polymers with different complex shapes and typical size ranges from 1 to 5 mm [1]. Such range is, first of all, determined by the methods of collection and identification of the particles, i.e. neustonic net mesh size, and optical microscopes resolution [2]. Despite emerging interest to that interdisciplinary problem, it is hard to tell that terminology in that area of knowledge is well established and widely accepted.
Very often microplastic appears toxic itself, but what is more dangerous, since it has large effective surface, it adsorbs different ecotoxicants, e.g. poly-chlorinated byphenils [2, 3]. If microplastics gets into a digestive system of marine micro-organisms, it may cause an effect of “false fullness” and propagate up through a food chain, that in turn leads to accumulation of toxic chemicals in the bodies of marine mammals and birds [4]. The researchers found that microplastics might serve as a transport mechanisms for invasive species from different ecosystems [5]. Nowadays microplastics pollution is found even in the Antarctic ice fields [6].
The aim of the present paper is to summarize our knowledge on the sources of microplastics in the marine environment and to propose a new way for parametrisation of the particles input in the model of microplastics transport for the Baltic Sea.
II. Net plastics balance estimate
Let us concentrate first on the net balance of plastic waste net flow in a semi-enclosed see, like the Baltic Sea, for example. It is widely accepted that 80% of it come from land sources and the rest 20% -- from the sea-based sources. The latter are typically placed along the intense shipping routes and are easily localized in space, but are hard to yield to quantitative assessment. The land-based sources are localized at the river estuaries, major cities, and beaches. All of those places are in contact with two principal natural actors: hydrodynamics and geomorphology which makes distribution of plastic waste at sea very patchy [7]. The human factor makes waste input irregular in time.
For the last decade plastics production and demand in Europe has been showing very slow growth, henceforth the speed of waste dumping into surrounding seas might overcome the growth rate. That might be the reason why plastic pellets became background contamination for the samples taken across the Mediterranean beaches (e.g. Malta, [8]). On the other hand, many Baltic countries implemented “zero dump” laws that prohibit dumping plastic waste to the landfills, which, in turn, might decrease waste input rate. It seems reasonable to assume that plastic waste concentration will remain more or less stable in the Baltic environment for the next decades, despite its much lower abundance.
According to [9], Table 1 shows a volume of “mismanaged plastic waste” (i.e. plastics waste that escaped recycling) for the Baltic countries estimates at 28 000 kg per day.
Table 1. Mismanaged plastic waste input for Baltic countries (from [9])
|
Country |
Coastal |
Inadequately managed plastic waste [kg/day] |
Mismanaged plastic waste [kg/person/year] |
|
Denmark |
5 376 386 |
0.0* |
0.37 |
|
Estonia |
878 021 |
13295.703 |
6.94 |
|
Finland |
2 927 674 |
0.0* |
1.83 |
|
Germany |
8 837 035 |
0.00014 |
3.54 |
|
Latvia |
1 432 078 |
24650.935 |
7.19 |
|
Lithuania |
443 894 |
8363.564 |
7.85 |
|
Norway |
4 131 679 |
0.0* |
2.19 |
|
Poland |
3 272 933 |
36715.231 |
4.75 |
|
Russia |
10 812 537 |
197225.826 |
7.30 |
|
Sweden |
6 202 234 |
0.0* |
0.37 |
*According to official data on production and waste management.
Collateral plastic litter input is underestimated.
Fig 1. schematically represents the relation between actual waste input and generation of microplastics pollution with a focus on the unknown links of chain.
Let us now try to estimate a net balance of the microplastics pollution in the Baltic Sea. It is important to take into account the demand of plastics in Europe: which consists of 50% heavy and 50% light [10] plastics. Light particles (with a positive buoyancy) will float away with the surface currents and after a certain time will be removed from the surface waters. Denser particles along with the less dense ones affected by biofouling should sink in a few days and deposit in bottom sediments.
Firstly, the surface currents that mainly outflow to the North Sea seem to be the main factor of the negative balance of microplastics with densities less than brackish water of the Baltic Proper. Actual rate of the removal might be estimated if we improve our knowledge on the mean concentrations of microplastics, but unification of measurement methods [11] is very important.
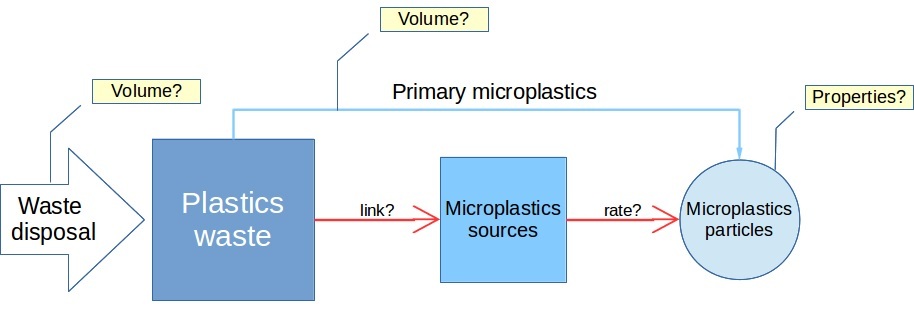
Fig 1. A pathway from unprocessed plastic waste to the microplastics pollution in marine environment.
Secondly, the denser plastics should be accumulated and deposited at the bottom (mainly in the shallow area close to the coast, with a high chance to be re-suspended), but also – in the deep-water area, which might be considered as another way of microplastics removal [5]. To estimate the rate of deposition for different types of plastics, we need to know their settling velocities. Study [12] discovered surprisingly low levels of microplastics at the sea surface when compared to those in the bottom sediments of the deep sea.
These two reasons provide relatively low concentrations of floating microplastics particles in the surface waters of the Baltic Sea [7, 13]. According to different scenarios of numerical modelling in [14] and [15], the Baltic Sea accumulates relatively low levels of plastic waste (much less than Mediterranean or Pacific); possibly, this is due to the currents regime that supports renewal of surface waters. Study [7] reports similar orders (10 particles per litre) of counts of microplastics for the opposite parts of the Baltic Sea, with a slight increase at the German coast. Authors of [12] give mean microplastics densities in the Mediterranean of 400 particles per litre.

Fig. 2. Conceptual representation of a net plastics balance in the Baltic Sea marine environment.
Common practice is to distinguish “primary” microplastics, e.g. industrial pellets, textile fibres, and microbeads from cosmetics, from the “secondary” microplastics that results from a partitioning of large plastic waste, fishing nets, etc. The latter processes manifest themselves most actively in the coastal zones. Unlike with the macroplastics [16], it is very hard to establish the origins of the microplastics samples, since the macro-waste degradation requires very long exposure to oxygen-rich environment and UV-radiation. The direct input of primary microplastic from the sea-based sources and the land-based sewage facilities might be assumed as much lower than input generated by the breaking pieces of plastic waste and storms removing microplastics from the beaches. Many authors, like [17], support the idea of microplastics particles accumulation at the shoreline, but its rate remains unknown. K-L. Law in [18] hypothesized the processes of microplastics removal from the marine ecosystem, but mentioned that rates remain unknown.
The scheme of the described processes is presented in Fig. 2.
From all that has been said it follows that if we were able to describe the generation of microplastics in the shallow-water bottom sediments, then we would able to parametrise the input of microplastics in the model. In such a case, first thing we need to take into account is the type of the bottom sediments.
When estimating the net input of the microplastics into the marine ecosystem along with surrounding beaches and estuaries, one needs to keep in mind that the only available data on the anthropogenic footprints for now are the statistical information on the average amount of mismanaged plastic waste (see Table 1). Importance of such numbers is contracted by the fact of long exposure of the existing huge plastic deposits to the allocating and equalizing action of the currents and winds. For example, there is no significant distinction in microplastic pollution levels between Slovenian beaches with different extent of human use [19].
III. Present approaches to the problem
Methods of numerical modelling of plastic waste transport are pretty well developed for the Global Ocean [14, 20, 21, 22] and data collected during marine expeditions are summarized in [11, 21]. Meanwhile, there is a huge gap between global and regional scale modelling of microplastics, although there is some progress in [5, 23, 24]. Physical properties of microplastics particles are little-known [25, 26], which interdicts their parameterisation in the numerical models for marine environment.
Table 2. A review of papers on the marine plastic waste transportation
|
Publication |
Loss of particles |
Transition from coast to the sea |
Vertical velocity |
Sources |
|
[23] |
Sedimentation depends on density and Feret’s diameter |
Resuspension due to critical erosion velocity |
Yes |
4 point sources |
|
[27] |
Landing, settling, degradation |
Resuspension |
Yes |
5 point sources |
|
[28] |
No beaching |
N/A |
No |
Shipping lanes and cities |
|
[14] |
A particle is considered ‘beached’ when it is adjacent to a coastal cell. No removal |
is not possible |
No |
Rivers, shipping lanes and cities. Even releases. |
|
[29] |
Removing the particles after 10 days of stagnation at the boundary cell |
is not possible |
No |
Rivers, shipping lanes and cities |
|
[24] |
Beaching count, no removal |
free |
No |
Day by day release at each grid cell |
|
[20] |
Removing the particles after 5 days of stagnation at the boundary cell |
is not possible |
No |
Instant release at each grid cell |
|
[21] |
No beaching |
N/A |
No |
Coastal urban population within 200 km zone; large rivers with urbanised estuaries |
Dense plastic transport in suspended state is estimated in [3]. Chances to be re-suspended certainly increase with increase in current velocity and significant wave height. Re-suspension was empirically parametrised in the model [27] as 0.2-0.4 particle per day. Laboratory experiments by [23] showed the critical tension values of 0.14 N per m2 (which corresponds to velocity of 0.2 cm per sec) for HD plastics (1055 kg per m3 with settling velocity of 28 mm per sec and size ~2 mm), while re-deposition started at 0.087 N per m2.
Submesoscale effects remain unknown, but for the particles with buoyancy close to neutral it is proven that subsurface concentration is influenced by turbulence. Settling velocity is high enough to settle in 1-2 days, but turbulence makes this time high enough for some heavy re-suspended particles of plastics and amber to be washed ashore after severe storms.
III. Results: suggested parameterisations
Coastal related input and stranding processes are crucial for assessing budgets of marine litter. We assume that particles of different sizes enter the sea with equal probability, despite the fact that in-situ measurements do not always confirm such distribution pattern [17, 30]. For spheroids with effective diameter of 1-5 mm, there is a linear dependence between the size and the number of particles generated from a large object of a fixed volume [30]. If a particle fits into one of five size classes from 1 to 5 mm with 1 mm step, then overall final quantity of such particles might be linked to the stock of large plastic waste. Polymer fibres should be treated as a separate class. For now it seems reasonable to introduce two major density classes: “heavy” and “light” particles, which could be modelled separately at the initial stage.Table 3 lists the factors affecting the final parameterisation:
- Seasonality manifests itself in plastics waste input as much as in the intensity of grinding action of the sea and natural factors in the coastal zone.
- Distinguishing of the exploited (urbanized, recreational or industrial) coastal zones from those less used reflects the direct anthropogenic pressure. One can assume the cell of a numerical grid as 'exploited' if there is at least one city with a population more than 100 000 people. Presence of objects that increase local level of plastics pollution, such as water treatment plants, ports, industries related to use of polymer pellets, etc. Study [2] demonstrated sufficient increase in the microplastics particle concentration near the water treatment plants at the coasts of the United Kingdom. Putting locations of such objects on the model grid is a very time-consuming task.
- Population density directly influences the quantity of primary microplastics generated by people, e.g. during visiting the beaches, and the volume of synthetic fibres and microbeads (from cosmetics) dumped into the sewer. Study [7] showed that even waste-water treatment plants could not be a guaranteed barrier to stop microplastics from domestic discharge entering the marine environment. The data on the population density are available according to census bureau [31].
- The data on the yearly input of the plastics waste (see Table 1) are needed to define the most influenced coastal zones. As it was mentioned before, 'heavy' plastics will be deposited close to the place of macroplastics destruction.
- Intensity of the wind waves is an additional factor that influences re-suspension and plastics breakdown. It may compensate for low velocities in the near-shore zone for the very tentative approach in the coarse resolved numerical models based on the reanalysis data. Such data are available, for example, via HELCOM [32].
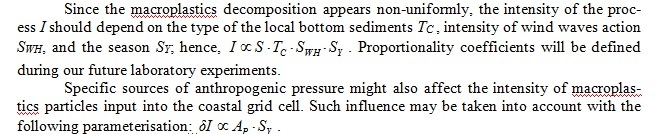
- Type of bottom sediments, last but not the least, has never been taken before into consideration for the mechanisms of microplastics generation. Different efficiency of mechanical destruction of macroplastics into the microplastics in the coastal zone is determined by the different types of bottom sediments. The parameter of 'mechanical conversion' for the different types of sediments (sand, granules, stones, pebble) acting to macroplastics samples is now studied experimentally by our team members. We plan to adapt such information for the numerical model along with available maps of sediments content for the Baltic Sea.
Table 3. Parameters list suggested for parameterisation
|
# |
Parameter |
Units |
Possible values |
Notes |
Variable |
Reference |
|
1 |
Season |
- |
0.5 ¸ 1.0 |
Waste input is maximal in Summer |
SY |
[5] |
|
2 |
Anthropogenic pressure |
- |
0/1
|
Waste treatment plant, sewer, port or a large river |
AP |
[2], [7] |
|
3 |
Population |
persons |
- |
Alongshore area ´ population density |
P |
[17] |
|
4 |
Typical plastic waste input for the country |
kg/person/year |
- |
Baltic countries |
W |
[9] |
|
5 |
Wind waves |
m |
- |
Climatic value for Significant wave height |
SWH |
- |
|
6 |
Shore type |
items/kg
|
clay, sand, pebble, stones |
Influences the microplastics generation from macro waste |
TC |
- |
A combination of the parameters proposed above allows us to parameterise the distribution of intensity of impulse inflow of the microplastics particles for every 'coastal' cell of the numerical grid. Such distribution in turn permits us to include the non-uniform input of the particles in the Lagrangian model of the microplastics transport. The results of the numerical experiments should be then normalized by the direct measurements of the background concentrations of microplastics pollution in the marine waters and in coastal sediments.
The concentration of particles produced in the coastal cell of the grid will depend on the share of the concentration of deposited plastics waste in the yearly input. Upper estimate is 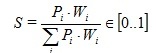 (here i stands for each of nine Baltic countries). Such concentration is high enough for the calculated nondimensional term S to change insignificantly on account of the waste transport during the period of numerical experiment.
IV. Discussion and conclusions
Unlike the existing approaches (see Table 2), we suggested defining and parameterising the input of the primary and secondary microplastics pollution to the marine environment for the subsequent study of its paths of migration and/or deposition. All previous studies transposed the properties of macroplastics to the microparticles and parameterised the source functions from the requirements of the Lagrangian models or from the available data on the plastics waste input. We assume the key factor in that process to be the destruction of plastic objects in the coastal and wave-breaking zones under the influence of photochemical and mechanical agents.
In our study we pointed out the principal agents that define the balance of the microplastics pollution in the Baltic Sea, according to the known in-situ data and circulation patterns of the Baltic Sea. Further on, we listed the parameters that need to be taken into consideration for parameterisation of the microplastics pollution sources. Those factors are relatively easy to define for each grid cell, depending on the available data bases and geological maps. We hope that further laboratory tests will reveal some coefficients of proportionality [33].
As any other semi-empirical approach, our method might be the subject to critics and improvement. Subsequent tests of its efficiency will be done during the numerical experiments.
IV. Acknowledgment
The investigations are supported by Russian Science Foundation via grant number 15-17-10020.
1. “Sources, fate and effects of microplastics in the marine environment: a global assessment” (Kershaw, P.J., ed.). IMO/FAO/UNESCO-IOC/UNIDO/WMO/IAEA/UN/UNEP/UNDP Joint Group of Experts on the Scientific Aspects of Marine Environmental Protection, 2015. Rep. Stud. GESAMP No. 90, 96 p.
2. M. Bergmann, L. Gutow, and M. Klages, Marine Anthropogenic Litter. Berlin, Springer, 2015; doihttps://doi.org/10.1007/978-3-319-16510-3.
3. M. Cole, P. Lindeque, C. Halsband, T. S. Galloway, “Microplastics as contaminants in the marine environment: A review,” Marine Pollution Bulletin, Volume 62, Issue 12, Pages 2588-2597, December 2011; http://dx.doi.org/10.1016/j.marpolbul.2011.09.025.
4. P.G. Ryan, C.J. Moore, J.A. van Franeker, and C.L. Moloney, “Monitoring the abundance of plastic debris in the marine environment,” Philosophical Transactions of the Royal Society B: Biological Sciences, 364(1526), pp 1999-2012, 2009.
5. “Marine litter in the Mediterranean and Black Seas,” [F. Briand, ed.]. CIESM Workshop Monograph n° 46, 180 p., CIESM Publisher, Monaco, 2014.
6. R.W. Obbard, et al., “Global warming releases microplastic legacy frozen in Arctic Sea ice,” Earth's Future, 2: 315-320, 2014; doihttps://doi.org/10.1002/2014EF000240.
7. J. Talvitie, et al. “Do wastewater treatment plants act as a potential point source of mi-croplastics? Preliminary study in the coastal Gulf of Finland, Baltic Sea,” Water Science and Technology, 72 (9): 1495-1504, 2015.
8. A. Turner and L. Holmes, “Occurrence, distribution and characteristics of beached plastic production pellets on the island of Malta (central Mediterranean),” Marine Pollution Bulletin, Volume 62, Issue 2, Pages 377-381, , February 2011; doihttps://doi.org/10.1016/j.marpolbul.2010.09.027.
9. J. R. Jambeck, et al., “Plastic waste inputs from land into the ocean,” Science, 347: 768-771, 2015.
10. PlasticsEurope (2015) Plastics - the Facts. Source: 2014/2015. http://www.plasticseurope.org/documents/document/20150227150049-final_plastics_the_facts_2014_2015_260215.pdf (last viewed: 21.01.2016).
11. M. Filella, “Questions of size and numbers in environmental research on microplastics: Methodological and conceptual aspects,” Environmental Chemistry, 12, 527-538, 2015; doihttps://doi.org/10.1071/EN15012.
12. L.C. Woodall, et al., “The deep sea is a major sink for microplastic debris,” Royal Society Open Science, 1(4), 2014; doihttps://doi.org/10.1098/rsos.140317.
13. A. Stolte, S. Forster, G. Gerdts, and H. Schubert, “Microplastic concentrations in beach sediments along the German Baltic coast,” Marine Pollution Bulletin, Volume 99, Issues 1-2, Pages 216-229, 15 October 2015; doi:https://doi.org/10.1016/j.marpolbul.2015.07.022.
14. L. C.-M Lebreton, S. D. Greer, and J. C. Borrero, “Numerical modelling of floating debris in the world’s oceans,” Marine Pollution Bulletin, 64, 653-661, 2012.
15. E. van Sebille, M. H. England, and G. Froyland, “Origin, dynamics and evolution of ocean garbage patches from observed surface drifters,” Environ. Res. Lett. 7 044040 (6pp), 2012.
16. A. V. Duhec, R. F. Jeanne, N. Maximenko, and J. Hafner, “Composition and potential origin of marine debris stranded in the Western Indian Ocean on remote Alphonse Island, Seychelles,” Marine Pollution Bulletin, Volume 96, Issues 1-2, Pages 76-86, 15 July 2015; doihttps://doi.org/10.1016/j.marpolbul.2015.05.042.
17. Browne, M.A., Crump, P., Niven, S.J., Teuten E.L., Tonkin, A., Galloway T. & Thompson, R.C. (2011). Accumulations of microplastic on shorelines worldwide: sources and sinks. Envi-ronmental Science & Technology, 45, 9175-9179.
18. Law KL, Morét-Ferguson SE, Maximenko NA, Proskurowski G, Peacock EE, Hafner J, et al. Plastic accumulation in the North Atlantic Subtropical Gyre. Science 2010;329: 1185-1188. doi:https://doi.org/10.1126/science.1192321
19. Betty J.L. Laglbauer, Rita Melo Franco-Santos, Miguel Andreu-Cazenave, Lisa Brunelli, Maria Papadatou, Andreja Palatinus, Mateja Grego, Tim Deprez, Macrodebris and microplastics from beaches in Slovenia, Marine Pollution Bulletin, Volume 89, Issues 1-2, 15 December 2014, Pages 356-366, ISSN 0025-326X, http://dx.doi.org/10.1016/j.marpolbul.2014.09.036
20. Nikolai Maximenko, Jan Hafner, Peter Niiler, Pathways of marine debris derived from tra-jectories of Lagrangian drifters, Marine Pollution Bulletin, Volume 65, Issues 1-3, 2012, Pages 51-62, ISSN 0025-326X, http://dx.doi.org/10.1016/j.marpolbul.2011.04.016.
21. Ivan Sebille E et al 2015 A global inventory of small floating plastic debris Environ. Res. Lett. 10 124006 (11pp)
22. Andrady, A.L., (2011). Microplastics in the marine environment. Marine Pollution Bulletin, 62:1596-1605
23. Ballent, A., Pando, S., Purser, A., Juliano, M. F., and Thomsen, L.: Modelled transport of benthic marine microplastic pollution in the Nazaré Canyon, Biogeosciences, 10, 7957-7970, doihttps://doi.org/10.5194/bg-10-7957-2013, 2013.
24. J. Mansui, A. Molcard, Y. Ourmières, Modelling the transport and accumulation of floating marine debris in the Mediterranean basin, Marine Pollution Bulletin, Volume 91, Issue 1, 15 February 2015, Pages 249-257, ISSN 0025-326X, http://dx.doi.org/10.1016/j.marpolbul.2014.11.037.
25. Wang J, Tan Z, Peng J, Qiu Q, Li M. The behaviors of microplastics in the marine environ-ment. // Mar Environ Res. 2015 Nov 8; 113:7-17
26. Ballent, A. Purser, P. de Jesus Mendes, S. Pando, and L. Thomsen Physical transport proper-ties of marine microplastic pollution // Biogeosciences Discuss., 9:18755-18798, 2012. doihttps://doi.org/10.5194/bgd-9-18755-2012
27. Kay Critchell, Jonathan Lambrechts, Modelling accumulation of marine plastics in the coastal zone; what are the dominant physical processes?, Estuarine, Coastal and Shelf Science, Volume 171, 20 March 2016, Pages 111-122, ISSN 0272-7714, http://dx.doi.org/10.1016/j.ecss.2016.01.036
28. Erikssen, M., Lebreton, L. C. M., Carson, H. S., Thiel, M., Moore, C. J., et al. (2014). Plastic pollution in the world’s oceans: More than 5 trillion plastic pieces weighing over 250,000 tons afloat at sea. PLoS ONE, 9, e111913
29. S. Liubartseva, G. Coppini, R. Lecci, S. Creti, Regional approach to modeling the transport of floating plastic debris in the Adriatic Sea, Marine Pollution Bulletin, Volume 103, Issues 1-2, 15 February 2016, Pages 115-127, ISSN 0025-326X, http://dx.doi.org/10.1016/j.marpolbul.2015.12.031
30. Cózar A., Echevarría F., González-Gordillo J. I., Irigoien X., Ubeda B., Hernández-León S., Palma A. T. et al. 2014. Plastic debris in the open ocean. Proceedings of the National Academy of Sciences of the United States of America, 111: 10239-10244
31. Gallego F. (2010) A population density grid of the European Union / Population and Envi-ronment , Volume 31, Issue 6, pp 460-473
32. Web-source: http://helcom.fi/baltic-sea-trends/environment-fact-sheets/hydrography/ wave-climate-in-the-baltic-sea. Last revised 20.04.2016
33. I. Chubarenko et al. On some physical and dynamical properties of microplastic particles in marine environment. Marine Pollution Bulletin (Accepted); doi:https://doi.org/10.1016/j.marpolbul.2016.04.048