


Russian Federation
Russian Federation
BISAC NAT010000 Ecology
BISAC NAT045050 Ecosystems & Habitats / Coastal Regions & Shorelines
BISAC NAT025000 Ecosystems & Habitats / Oceans & Seas
BISAC NAT045030 Ecosystems & Habitats / Polar Regions
BISAC SCI081000 Earth Sciences / Hydrology
BISAC SCI092000 Global Warming & Climate Change
BISAC SCI020000 Life Sciences / Ecology
BISAC SCI039000 Life Sciences / Marine Biology
BISAC SOC053000 Regional Studies
BISAC TEC060000 Marine & Naval
Ice gouging is a dangerous natural process typical for the coastal-shelf zone of the Russian Arctic; because it leads to damaging of the infrastructure it can also be related to the category of catastrophic processes. To lower the risks of occurrence and to prevent emergencies and their consequences, comprehensive monitoring of the dangerous natural processes is necessary. With all lithologic and geomorphologic conditions being equal, the intensity of the ice gouging on the bottom is mostly determined by the changing condition, area and thickness of the ice cover. To assess the real intensity of the ice gouging impact during a given ice season, repeated sounding of the sea bottom topography is necessary; it helps to select the ice gouges which were created in the period between the two consequent observations. At present, the methods and technologies of the monitoring of ice gouging processes are not standardized, and the monitoring, if it is conducted, is often sporadic and lacks systematization. Therefore, the development of a united technology of comprehensive monitoring of ice gouging processes in the coastal and shelf zone is one of the most important tasks of the modern science and practice. Our team was the first one to apply such integrative technology in 2005-2015 in the framework of investigations for the purpose of construction of the underwater gas pipeline at its crossing of the Baydaratskaya Bay, Kara Sea.
sea ice, ice ridges, seabed, ice gouging, geotechnical safety, technology of monitoring
I. Introduction
Sea ice, as a zonal factor associated with the high latitudes of Arctic seas, plays an important role in the evolution of northern coasts. The ongoing development of oil and gas fields and the construction of relevant engineering facilities in the coastal and shelf areas (including navigation channels, coastal terminals, drilling platforms, submarine pipelines, and artificial islands) require new information on the effects of sea ice on coastal and seabed dynamics. This is one of the most important factors determining the selection of pipeline landfall sites, shore-crossing design, and required depths of burial.
Ice gouging is a destructive mechanical impact of ice on the underlying ground surface (Fig. 1). This impact on the shore and the floor of the Arctic seas is driven by the ice cover dynamics and mobility, hummocking (ridging), and formation of grounded hummocks (pressure ridges) controlled by hydrometeorological factors and coastal topography [1]. In direct observations from submarines, keels of large hummock formations reaching 50 m depth have been recorded [2].
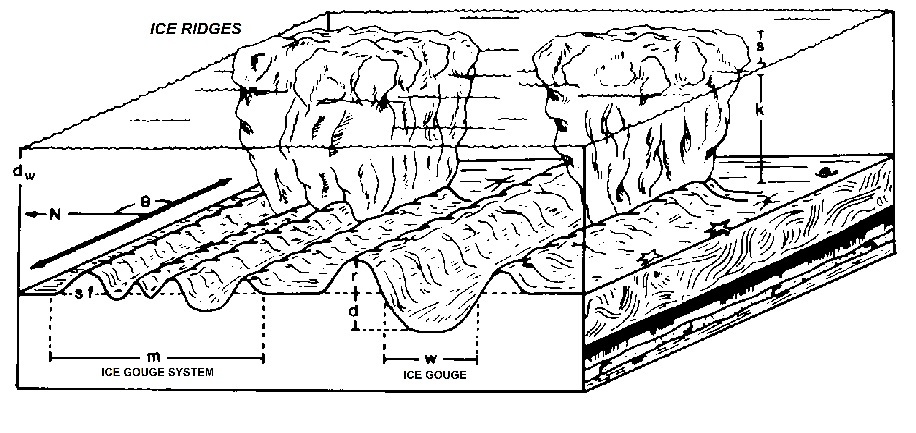
Fig. 1. Scheme of formation of systems of parallel ice gouges by hummocky formations with multiple keels, and of separate ice gouges by hummocks with one keel [3]: k – water depth; s – keel height (above sea level); d- depth of the ice gouge; w – width of the ice gouge; r – height of the push ridge; m – width of the system of ice gouges; sf – width of the push ridge; θ – direction of the ice gouge.
Until recently, little work has been done in Russia on the interaction between sea ice and the sea floor in coastal regions, whereas abroad, especially in Canada and the USA, there is a long history of research on this topic. American and Canadian researchers have documented the occurrence and processes of bottom scour and related seabed forms associated with pressure ridges and grounded ridges (stamukhi). Pioneering studies were undertaken on the Alaska shelf [4, 5, 6, 7, 8]. With the help of echo sounders and diving surveys, later augmented by sidescan sonar, ice gouges were found on the sea floor at depths of 0-65 m (a few deeper), with the highest density in depths of 20-40 m. They were up to 2 km long, incised as deep as 2,5 m into the sea floor, and were up to 67 m wide [3]. In the Canadian Beaufort Sea, seminal work [9, 10, 11] established that ice scour occurred out to about 55 m depth, was most intense if the depth range of 15-40 m, and that depths of scour penetration were typically <1 m but as deep as 7,6 m.
In Russia, special studies of the sea ice impacts (first of all, the effect of ice gouging) started significantly later and were carried out in the areas of submarine pipeline construction [12, 13, 14].
In 2011, the so-called “Nord-Stream Gas Pipeline” directly connected Russia and Germany through the seabed of the Baltic Sea. In 2013 this pipeline will reach full capacity. To provide gas for this pipeline, in 2005, the “Yamal-Europe” pipeline project (Environmental conditions …, 1997), the lines of which would cross Baydaratskaya Bay, was revived and by August 2007, the construction of the underwater crossing of the main gas pipeline across the Baydaratskaya Bay was underway. This was to connect gas fields of the Yamal Peninsula with the pipeline network in the European part of Russia by the shortest route (Fig. 2a). The length of the underwater part of the pipeline is approximately 65 km, the maximum bottom depth in the crossing area is 22-23 m. In connection with the renewing of the project, investigations of coastal zone dynamics and sea ice effects continued in 2005 after a 10-year hiatus. In order to assess the impact of the ice on the sea bottom, a wide range of investigations has been carried out, including field studies as well as mathematical modeling. Some of the results and scientific conclusions of the work in which the authors participated directly are presented in this paper.
II. Ice Conditions
The autumn ice formation in Baydaratskaya Bay usually occurs in the absence of residual ice, i.e. in open water. The climatic mean freeze-up date for the formation of stable ice is about 15-20 October. Year-to-year variations in the hydro-meteorological conditions determine the temporal range of freeze-up. In more seaward parts of the bay remote from the shore, freeze-up occurs 10-15 days later the ice formation close to shore. After the ice cover reaches the grey-white stage, the rate of further growth in ice thickness is directly proportional to the intensity of the underlying surface cooling and poorly correlated to the date of stable ice formation. Ice thickness typically increases every 10 days by 8-10 cm from November to February and then declines to 5-6 cm per 10 days in March, 2-4 cm in April, and 1-2 cm in May. It is important to note that the mean ice thickness along the shallow Yamal coast is generally greater than along the steep Ural coast. By the end of the cold season, the ice thickness along the Yamal coast reaches 140 cm on average, i.e. the ice cover in general fits into the category of thick first-year ice. Across the bay along the Ural coast, the annual maximum ice thickness is typically only 120 cm. The ice cover in that area often does not qualify as thick first-year ice and is categorized as medium first-year ice.
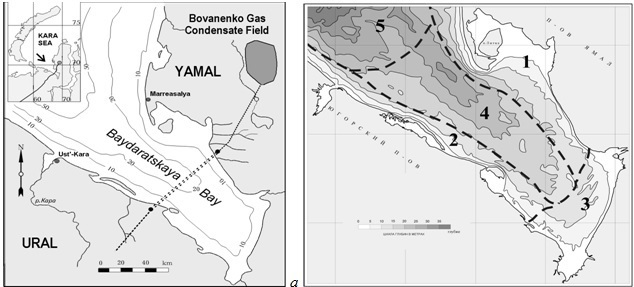
Fig. 2. (a) - “Yamal-Europe” gas pipelines crossing Baydaratskaya Bay in the Kara Sea; (b) – Ice cover of Baydaratskaya Bay: 1 – fast ice of Yamal Coast, 2 – fast ice of Ural Coast, 3 – fast ice of inner bay, 4 – drift ice of axis part of the bay, 5 – drift ice of open sea
The sea ice of Baydaratskaya Bay consists of drift ice and fast ice (Fig. 2b). Close to the open parts of the Yamal and Ural coasts, fast ice forms 20-30 days after the initial freeze-up, with a thickness of approximately 30 cm. This young, relatively thin, fast ice is very unstable in the initial stages and therefore it can be easily broken strong wind shear or sea-level rise. However, with the growth of sea ice thickness (up to 0,5 m) and the formation of ice hummocks and stamukhas, stabilizing ice conditions, the fast ice resistance increases considerably. Stable fast ice forms near the Yamal coast and in the inner part of the bay only. Next to the Ural coast, fast ice is less stable and in the last several years, cases of its break-away have been observed. In the early part of the season, the fast ice spreads seaward quickly, its outer border reaching the 5-7 m isobath in November and the 8-10 m isobath in December. In February-March the seaward border of fast ice corresponds to the isobath of 15 m at the Yamal coast, where its width is 7-9 km, and to the isobaths of 10-12 m off the Ural coast, where its width is approximately 5-7 km.
Drift ice consists of ice fields of different sizes. Compared with the immobile fast ice, in the same equal conditions, the thickness of drifting ice is generally less. Along the interface between fast ice and pack ice, as well as on the borders of drifting ice fields, ice hummocks (pressure ridges) form. Ice hummocks freeze into ice fields, building up complex ice formations, which drift together.
Analysis of ice field size for April 2006 based on satellite imagery has shown that most of the ice fields (floes) are less than 2 km in diameter, though several reach sizes of 6-10 km. The maximum vertical dimension of pressure ridges observed in Baydaratskaya Bay, including both the sail and the keel, reaches 30 m, while the length can be up to 300 m. The mass of a 1 km diameter ice field with ice thickness of 1 m is approximately 106 tons. The mass of the largest pressure ridge 30 m × 30 m × 300 m is therefore about 2.7×10⁵ tons, far less than the mass of the 1 km ice field [15]. Consequently, the ice scour process in Baydarakskaya Bay is dominated by the mass of ice fields with pressure ridges (ice hummocks and their associated keels) frozen in and incorporated within them, rather than by individual ridges.
The driving forces of ice-field drift are the wind and currents and the shear stress they exert on the upper and lower surfaces of the ice field. Currents measured in the ice-free period are practically reversive and aligned long the axis of the bay. Currents are driven by the semidiurnal tide. The maximum speed of the tidal current during the tidal cycle is 0,5, while the measured maximum current speed is 1,0 m per second. The maximum tidal range (spring tides) is 1,1 m, but including storm surges, the water levels have a range of up to 2 m. During the winter season, southwesterly and southerly winds prevail. In the absence of counteracting currents, these winds create conditions for ice drift from the Ural to the Yamal coast of the bay.
III. Methods
The most commonly used approach to the assessment of sea-ice impacts on the coast and seabed is statistic analysis of data on the distribution and parameters of the ice scour features and the variability of this parameter over time. Acquiring a wide knowledge of the distribution and penetration depth of ice gouges on an extensive area of seabed is possible only with the use of specialized geophysical equipment – side-scan sonar, multibeam sounding, interferometric sidescan, acoustic sub-bottom profilers and GPS/GLONASS positioning systems. Investigations of the bottom ice gouging are conducted from a specialized research vessel equipped with these devices (Fig. 3a). For field surveys of the ice gouging microrelief and determining the morphology and morphometric parameters of ice gouging forms on the sea bottom, we use a complex approach, which allows us to combine the results of several complementary methods. Side-scan sonar and echo-sounding surveys are executed at the same time from the same vessel.
The position of the sounding tracks is determined with high precision using modern GPS and GLONASS receivers, accepting WAAS error corrections. The speed of the vessel during the tracks should not exceed 4 knots. All the information coming from the side-scan sonar, echo sounder, and GPS/GLONASS goes to the computer module and is observed at the monitor in real time. It is registered on the hard drive with the help of the licensed software provided by the sonar equipment suppliers. An echo-sounding profile shows the morphology and morphometry of the forms (depth, width, etc.), as well as whether they are filled with bottom sediments; the side-scan sonar gives the idea of spatial distribution and orientation of the ice gouging forms. Inertial motion units tracking the 3D motion of the survey vessel improve quality by reducing the noise arising from pitch, roll, yaw, or (more commonly) combinations of all three.
As a rule, such investigations are conducted with the aim of assessing ice gouging impacts on the seafloor and oil and gas transportation infrastructure (trenches, pipelines) on the bottom. The spatial resolution of the soundings is determined by proximity to the projected objects and the necessity of repeating previous sounding tracks (Fig. 3b). To assess the intensity of the ice scour at the present time, it is necessary to conduct repeated soundings and to distinguish forms which appeared between the two measurements. In the context of climate change, identification of “fresh” gouges is especially important in light of the climate warming of the last few years causing changes in the ice regime and displacing the maximum impact zone towards shallower water.
In this study, the position of the pipeline and the number, depth, width, orientation and bottom sediment fill of the ice scour troughs which have appeared between investigations conducted in different years are documented. For this purpose, the tracks of new surveys should coincide with the previous ones, and the same type of equipment should be used. The field stage is only the first step in the complex geophysical survey processing stream. This work enables statistical processing of morphometric data on the ice gouging forms, distribution, and parameters.
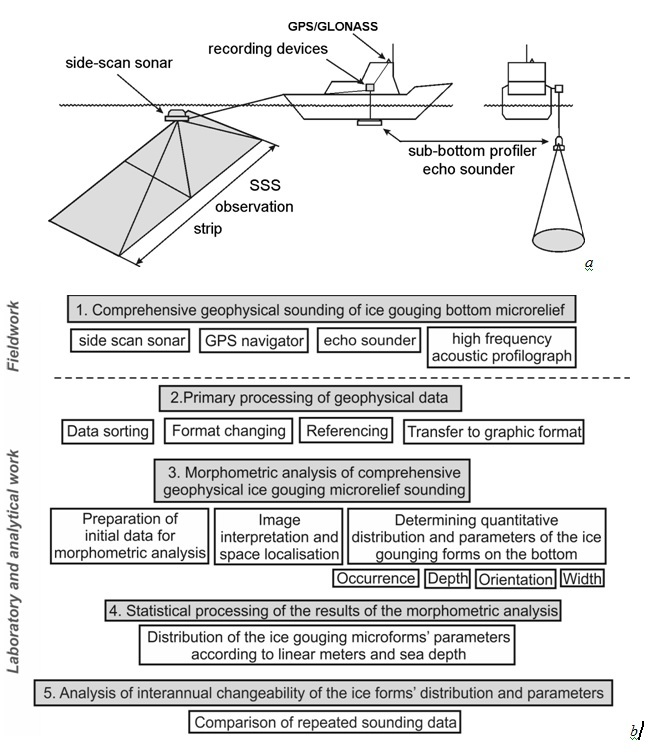
Fig. 3. Geophysical survey technology for mapping ice-gouging seabed topography: a – research vessel with geophysical survey devices; b – ice gouging technology intensity assessment.
IV. Results
The first subdivision of the coastal zone of Baydaratskaya Bay by the types of ice formation and their effect on the sea coasts and floor was by V.A. Sovershaev [12], who has made a huge contribution to studies of Arctic coastal dynamics. Detailed investigations performed in recent years under the guidance of the lead author, have made it possible to refine Sovershaev’s model regarding the characteristics of ice formation as well as understanding of the mechanisms of ice scour (Fig. 4).
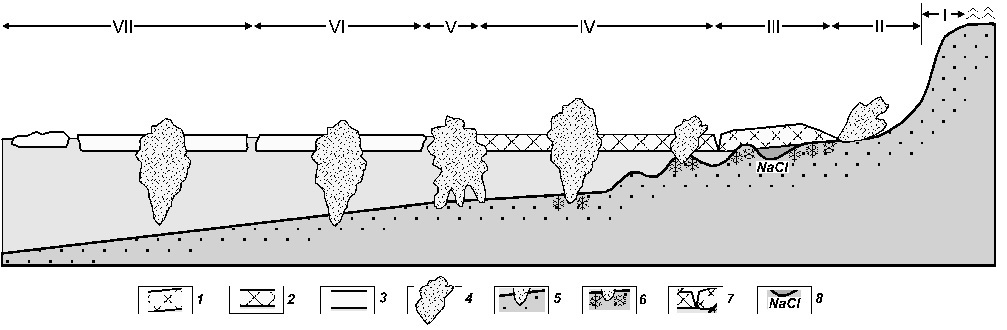
Fig. 4. Subdivision of coastal zone by types of ice formations and their effects on coasts and seabed [16]: 1 – fast ice frozen to the bed; 2 – floating fast ice; 3 – drift ice floes; 4 – hummocks ice formations (ice ridges, grounded hummocks and ice dam), ice piles and overthrusts; 5 – hummock keel penetration into the ground; 6 – seasonally frozen ice forming at contact between ice and bed; 7 tidal crack; 8 – high-salinity water in longshore troughs, cryopegs.
Sea coasts are affected by ice during the periods of ice formation in autumn and fast-ice destruction and break-up in spring. On shoreline composed of sand-pebble material, the imprint of ice push is clearly defined. Our surveys reveal the widespread occurrence of ridges formed by ice-push (Fig. 4, div. II). In autumn and early winter, young sea ice (20-40 cm thick) can be pushed onshore through wind-driven ice ride-up (unbroken floe) or pile-up (equivalent to pressure-ridge formation). During an ice-push event, the solid ice cover trims off the beach sediments and forms ridges of unsorted material [7]. In spring the ice also produces small-scale forms, such as furrows, striations, wallow depressions and also various ice-pushed ridges, all of which appear on sandy beaches [17]. The depth of these forms does not usually exceed 0,5–1,0 m, and the length is typically <50 m. Most ice gouges are oriented transverse to the coastline. These forms, along with most of the ice squeezing forms, are usually preserved until the first considerable storm.
The mechanical action of the ice on the sea bottom lasts from the onset of ice formation until the sea is completely free of ice. After young ice freezes to the seafloor in the nearshore zone, this new strip of ice serves as a protective buffer. The ridges of hummocks closest to the coast develop above submarine bars [18]. Because of a decreased sea depth above these bars, they become the focus of ridging and, thus the number of hummock ridges commonly corresponds to the number of submarine bars. Due to the onshore pushing impact of sea ice, ice gouges in this zone are mostly oriented normal to the coastline. The effect of the coastal hummock ridges and barriers on beaches and in shallow areas (down to a depth of 7-10 m) can be traced only immediately after fast ice is destroyed. The life expectancy of ice-gouged forms developed on sand beaches and shallow areas is very short, until the first summer storm. These forms, the depth of which is mainly <0.5 m, commonly disappear with the first strong waves in summer and autumn.
Further out in the bay, the pattern of hummocky pressure ridges is irregular and controlled by hydrodynamic factors, particularly the location of the fast ice edge during storms. Storm winds can destroy the fast ice edge and form a new ridge of hummocks or single grounded hummocks. The pattern of ice plowing in this case is either chaotic or parallel to the coastline. This is due to the prevailing along-shore drift of hummock formations. After the final onset of the fast ice the stamukhi remain non-mobile, often frozen down to the bottom. After their melting small (up to 1 m deep) holes and shallow, relatively short ice gouges remain. Ice gouges in this area are oriented mostly either chaotically or normally to the coastline, which is enhanced by the pressure of ice from the seaward side. Due to high hydrodynamic activity here, the gouges are quickly smoothed, and the gouge density in shallow areas is lower than in the zone of the fast ice edge.
The fast ice edge (within Baydaratskaya Bay near the 10-15 m isobaths) is the zone where the ice impact on the sea floor is the strongest. Here, pressure ridges reaching the floor (“ice dam”) develop throughout the winter (Fig. 4, div. V). In this case, ice gouges form a so-called “comb”, usually oriented normal to the coastline due to the pressure of ice from the open sea. In 2007, during sonar tracking from the research vessel Ivan Petrov, such a “comb” was observed with dimensions of approximately 70 m wide and 400 m long; it consisted of a system of parallel ice gouges up to 1,5 m deep (Fig. 5). Ice gouges are well preserved at this depth. They can be partly smoothed during extreme storms only. At depths of 14–16 m (within Baydaratskaya Bay), the occurrence and density of ice gouges turns out to be lower than at greater depths, though ice gouging is the most intense (most of the mobile systems of hummocks and grounded hummocks are formed here). The above situation is due to more active hydrodynamics at shallow depths, where the wave effect still influences the bottom and the velocities of tidal currents are higher. Due to this, the gouges at depth can exist over several years – first decade years here (as distinct from their short existence in shallow areas), gradually smoothing over and vanishing.
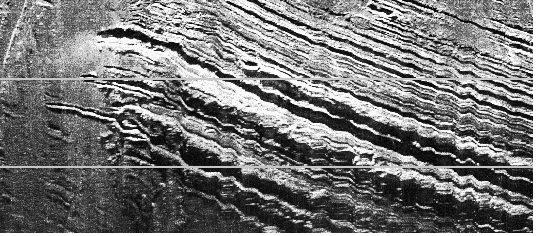
Fig. 5. “Comb” ice gouges on Baydaratskaya Bay bottom
The most intensive and deep ice gouges occur in the area of drift ice at the range of depths from 16 to 19 m, next to the Yamal coast fast-ice rim, where ice hummocks is going on during the whole cold season and along which ice fields and hummocks, reaching the bottom frozen into them drift (Fig. 6). Given the fact that the mass of the whole ice formation (floe and hummock) participates in the ice gouging, the deepest (up to 2 m), the widest (up to 50 m) and the longest (up to several km) ice gouges have been observed in this area. They are oriented conformably with tidal currents directions – lengthwise the Baydaratskaya Bay. Due to the low hydrodynamic activity at these depths, unaffected by wave action, the rates of sedimentation are very low. As a result, ice gouges are well preserved on the sea bottom and are mostly superimposed. Sometimes they cover up to 100% of the sea bottom [1]. Deeper than 19 m, ice gouges occur rather frequently. However, ice formations rarely occur at these depths. This situation is caused by a low hydrodynamic activity and low sedimentation rates. Under such conditions, the gouges, especially large ones, can exist on the bottom surface for decades. Thus, a low intensity of ice gouging is compensated by the long life of gouge forms. This “accumulation” effect gives a false impression of a high intensity of ice gouging here.
.jpg)
At depths exceeding the maximum possible hummock thickness, 23-26 m in this area, bottom ice gouging stops. Ice gouges are rarely observed here. The hypothesis is that ice gouges at these depths are left by icebergs. Icebergs have been documented in Baydaratskaya Bay documented very rarely, including in 1932 and 2007 (Fig. 4, div. VI). It is possible that the appearance of icebergs is connected to warm periods and occurs during the time of minimum ice cover.
V. Discussion
With all lithologic and geomorphologic conditions being equal, the intensity of the ice gouging on the bottom is mostly determined by the changing condition, area and thickness of the ice cover. These characteristics can be obtained based on the data of hydrometeorological stations and on satellite observations followed by the analysis of the results of the sounding of ice gouging microrelief for different years.
As a result of the warming, in autumn of 2007 and 2012, a historical minimum of sea ice area since the beginning of satellite observations in 1979 was reached in the Northern Hemisphere. The border of fast ice changes as well. With all other conditions being equal, the greater the sum of temperatures below zero is, the more stable and wide the fast ice can be. So, over the last decade only, the area of fast ice at the moment of its maximal extent decreased by 15% [19]. The ice-free period duration, in its turn, increased. Under the conditions of climate warming, the character and intensity of ice gouging impact of ice formations on the coasts and bottom change considerably. Due to the decrease of the ice period duration and ice thickness, an activation of all the processes connected to sea ice occurs; ice hummocking increases. As a result, the width and stability of fast ice becomes lower; the action of sea ice on the coasts grows.
During the last decades, along with the climate warming in the Arctic basin, not only a general decrease of the ice cover is observed, but also the circulation system of sea water and ice is changing, which leads to a redistribution of areas with thin young and thick perennial pack ice. Among the first-year ice, clear anomalies of the ice cover thickness are observed in the last decade [19]. A decrease of the ice thickness immediately leads to changes in the size of the hummocky ice formations, the deepening of which directly depends on the ice thickness. These two parameters are directly connected. During the last two decades, the duration of the ice period in the Baydaratskaya Bay decreased almost by 1,5 months; the fast ice often breaks and can be carried away during its formation (especially from the side of the Ural coast); the thickness of the ice cover decreased at least by 10-15 sm [19].
To assess the real intensity of the ice gouging impact during a given ice season, repeated sounding of the sea bottom microrelief is necessary, in order to select the ice gouges which were created in the period between the two consequent observations. Field geophysical observations, including monitoring observations (made for the same profiles repeatedly), were made in the Baydaratskaya Bay of the Kara Sea and within the territory of the gas pipeline underwater crossing in the period from 2005 to 2012, corresponding to a significant climate warming and ice decrease in the Kara Sea.
Young ice gouges, which were formed after the construction of the Baydaratskaya Bay underwater pipeline crossing, are easy to detect above the recently filled trench on the bottom: fresh gouges leave traces on the ground deposited by the constructors, similar to a pencil leaving traces on a clean piece of paper (Fig. 7). The executed observations prove that during the last years, a decrease of the ice cover thickness and the ice hummocks’ size together with the fast ice width was observed. As a result, the area of the most intensive ice gouging impact moves to smaller water depths. If before, the maximum of the ice gouging impact (by the number and depth of ice gouges) was observed at depths from 17 to 20 m, at present, this zone has moved to 12-16 m (Fig. 7). Ice gouges have stopped forming in the central, deep part of the bay.
Based on comprehensive monitoring observations, it has been established that in the conditions of climate warming and ice cover decrease, the zone of the most intensive ice impact is moved landwards, to areas of shallower water areas.


.jpg)
VI. Acknowledgment
The work was executed with the financial support of the Russian Science Foundation project No. 16-17-00034
1. S.A. Ogorodov, The Role of Sea Ice in the Coastal Zone Dynamics of the Arctic Seas, Water Resources, 2003, v. 30, no. 5, p. 509-518.
2. A.P. Lisitzyn, Sea-ice sedimentation in the World Ocean. Moscow, Nauka, 1994, 448 p. (in Russian).
3. P.W. Barnes, D.M. Rearic, and E. Reimnitz, Ice gouging characteristics and processes. In: The Alaskan Beaufort Sea: Ecosystems and Environments (eds. P.W. Barnes, D.M. Schell, E. Reimnitz). Academic Press, Orlando, 1984, p. 185-212.
4. A.J. Carsola, Extent of glaciation on the continental shelf in the Beaufort Sea, Amer. J. Sci. 1954. v. 252, no 6, p. 366-371.
5. R.W. Rex, Microrelief produced by sea ice grounding in the Chukchi Sea near Barrow, Alaska. In: Arctic, 1955, v. 8, no 3, p. 177-186.
6. E. Reimnitz, P.W. Barnes, Sea ice as a geologic agent on the Beaufort Sea shelf of Alaska, The Coast and Shelf of the Beaufort Sea (eds. J.C. Reed and J.E. Sater). Arctic Institute of North America, Arlington. 1974. p. 301-353.
7. P.W. Barnes, Marine ice-pushed boulder ridge, Beaufort Sea, Alaska, In: Arctic, 1982, v. 35, no. 2, p. 312-316.
8. E. Reimnitz and E.W Kempema,. Pack ice interaction with Stamukhi Shoal, Beaufort Sea, Alaska. In: Alaskan Beaufort Sea: Ecosystems and Environments (eds. P.W. Barnes, D.M. Schell, E. Reimnitz). Academic Press, Orlando, 1984, p. 159-183.
9. J.M. Shearer and S.M. Blasco, Further observations of the scouring phenomenon in the Beaufort Sea. Geological Survey of Canada, 1975, p. 1-75.
10. C.F.M. Lewis, Estimation of the frequency and magnitude of drift-ice groundings from the ice scour tracks in the Canadian Beaufort Sea, Proceedings, 4th International Conference on Port and Ocean Engineering under Arctic Conditions, St. John’s NL, 1977, v. 1, p. 568-579.
11. J. Hnatiuk and K. Brown, Sea bottom scouring in the Canadian Beaufort Sea, Proceedings 9th Annual Offshoe Technology Conference, Houston, 1977, v. 3, p. 519-527.
12. G.I. Dubikov, V.A. Sovershaev and V.S. Tuzhilkin (eds.), Environmental conditions of the Baydaratskaya Bay. Main results of investigations for construction of submarine passage), 1997. Moscow, GEOS, 432 p. (in Russian).
13. S.A. Vershinin, P.A. Truskov and K.V. Kuzmichev, Ice effect on the constructions at Sakhalin shelf. Moscow: "Giprostroymost Institute", 2005, 208 c. (in Russian).
14. G.K. Zubakin (ed.), Ice formations in the Western Arctic seas. St. Petersburg. AARI. 2006. 272 p. (in Russian).
15. A.V. Marchenko, S.A. Ogorodov, A.V. Shestov and A.S. Tsvetsinsky, Ice gouging in Baydaratskaya bay of the Kara Sea: field studies and numerical simulations, Proceeding of 19th International Conference on Port and Ocean Engineering Under Arctic Conditions, POAC-07, Dalian, China, June 27-30, 2007, p. 747-759.
16. S.A. Ogorodov, The Role of Sea Ice in Coastal Dynamics. - Moscow University Press, 2011, 173 p. ISBN 978-5211-06275-7. (in Russian).
17. D.L. Forbes and R.B. Taylor, Ice in the shore zone and the geomorphology of cold coasts, Progress in Physical Geography, 1994, v. 18, no. 1, p. 59-89.
18. D.L. Forbes, G.K. Manson et al., Nearshore ice and climate change in the southern Gulf of St. Lawrence, Ice in the Environment: Proceedings, 16th International Symposium on Ice. Int. Association of Hydraulic Engineering and Research, Dunedin, New Zealand, 2002, p. 344-351.
19. I.E. Frolov (ed.), Review of the hydrometeorologic processes in the Arctic Ocean in 2014, Rotaprint GNC RF AARI, 2015, 124 pp. (in Russian).
20. S.A. Ogorodov, V.V. Arkhipov and O.V. Kokin, Climate Change Effect on the Intensity of Seabed Gouging by Hummocky Ice Floes, In: Arctic, Subarctic: mosaic, contrast, variability of the Cryosphere: Proceedings of the International Conference, V.P. Melnikov and D.S. Drozdov (ed.) - Tyumen: Epoha publishing house, 2015. p. 269-271. (in Russian).