


BISAC NAT010000 Ecology
BISAC NAT045050 Ecosystems & Habitats / Coastal Regions & Shorelines
BISAC NAT025000 Ecosystems & Habitats / Oceans & Seas
BISAC NAT045030 Ecosystems & Habitats / Polar Regions
BISAC SCI081000 Earth Sciences / Hydrology
BISAC SCI092000 Global Warming & Climate Change
BISAC SCI020000 Life Sciences / Ecology
BISAC SCI039000 Life Sciences / Marine Biology
BISAC SOC053000 Regional Studies
BISAC TEC060000 Marine & Naval
The paper describes application of the terrestrial laser scanner for investigation of coastal dynamics of the Svetlogorskaya Bay, Baltic Sea. Methods of investigation and results of surveys repeated over the two consecutive years for quantification of coastal erosion and slope processes within the coastal zone are presented.
Baltic Sea, coastal geomorphology, geoinformatic methods of investigation, terrestrial laser scanner.
I. Introduction
Northern coastline of the Sambiyskiy Peninsula (Kaliningrad Region, Russia) is characterized by actively eroded cliff from 5 to about 60 m high above the sea level. It is a subject of active hillslope processes provoked by wave erosion of the cliff base. The existing protective and enforcing constructions in the coastal zone are in unsatisfactory conditions and cannot provide necessary protection of the eroded cliffs from hazardous processes. It is therefore important to determine spatial distribution and dynamic variability of coastal erosion. This task requires regular morphometric observations by means of cartographic and geodetic methods. Combined use of the existing maps and remote sensing data can provide general understanding for longer time intervals between dates of the information sources available, or for zones where coastal retreat has catastrophic rates. This can be explained by absence of the detailed-scale maps (larger than 1:10000) for the coastal zone. Problem for detailed measurements from the remote sensing data sources is widespread forests along the cliff break within the studied areas. The most effective approach for quantification of coastal dynamics is in most cases regularly repeated geodetic surveys. Local researchers from the “Baltberegozaschita” have installed a network of fixed geodetic points used for regular surveys of cliff profiles at a number of locations [1]. Authors have attempted to use the same network for organization of cliff surveys by means of the terrestrial laser scanner (further – TLS) system (Fig. 1).
II. Field survey methods
The TLS technology is actively used for large-scale geomorphic monitoring in various environments. It is particularly useful for the coastal zones dominated by eroded retreating cliffs. [2, 3]. Its major advantage is in its detailness and automation as survey (after the scanner is appropriately configured) is carried out automatically and covers the entire area of interest with required density of the survey points. TLS application also allows carrying out distant measurements for the locations unreachable by surveyors (such as extremely steep cliff faces). Its disadvantage, however, is in complexity of the post-processing caused by large number of survey points and necessity of their filtration due to possible presence of reflective objects unrelated to the topographic surface, such as vegetation.
.jpg)
Fig. 1. Location of surveyed cliff sections along the Svetlogorsk coastline.
The first field survey was carried out in February, 2013 along the Svetlogorsk City coastal cliff sections with total length of survey about 3 km (Fig. 1). The TLS system used was MDL LaserAce 600P. Fieldworks were carried out during wintertime when deciduous trees were devoid of leaves, thus decreasing their reflectance and making the post-processing point filtering less laborious. In order to guarantee complete coverage of the surveyed coastline area, scanning was carried out from seven geodetically fixed position. Their locations were arrange to allow partial mutual coverage of the adjacent survey scenes. At least 4 orienting target points were used within every survey scene. Prior to the scanning, geodetic coordinates of the survey point and orienting target points were determined by means of the differential GPS (further – DGPS) survey by pair of the Trimble 5700 receivers. Measurements were obtained in the static regime allowing the spatial accuracy within 2 cm. Obtained geodetic coordinates of the survey point and orienting target points in unified coordinate system were later used for orienting each of the TLS survey scene within the same coordinate system. That allows integration of several separate survey scenes into a single point cloud.
Repeated survey of active cliffs along the same coastal section was carried out in November, 2015 (Fig. 1). In this case survey points were located in areas where maximum visibly evident cliff deformations occurred during the time interval passed since the first survey (22 months). As during the first survey, DGPS survey in static mode was used for obtaining geodetic coordinates of the survey point and orienting target points with the accuracy required.
III. Geoinformatic methods of The TLS survey data post-processing
Post-processing of the TLS survey spatial point clouds was carried out using the software package CloudCompare version 2.6.1. The raw scanning schemes for the two survey dates initially represented in the local polar coordinate system from the survey points were recalculated basing on the DGPS measurements into a single local rectangular coordinate system. Having the control points measured both by DGPS and TLS made it possible to check the orientation precision. It was found out that discrepancies of control points coordinates between DGPS and TLS surveys does not exceed 2-3 cm.
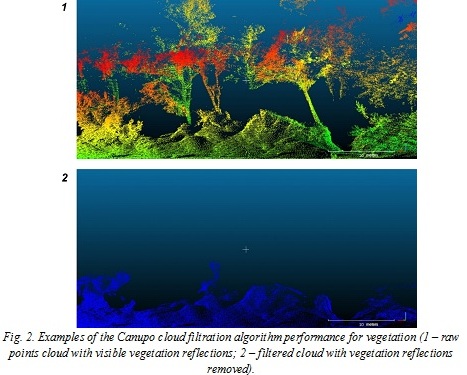
Raw point clouds of the TLS survey characterize different types of objects. As our survey purpose was to investigate topographic surface dynamics, it was required to remove all raw points unrelated to reflections from the topographic surface. This post-processing operation is required to minimize distortion of final output. The filtration procedure was carried out semi-automatically using the CloudCompare software package algorithm Canupo described in details elsewhere [4]. Firstly the training samples were selected for points representing reflections from non-topographic surfaces. Secondly the software algorithm automatically removed all the points falling into the training samples selection criteria. Example of the raw point cloud filtration for vegetation is shown on Fig. 2.
IV. Results
After post-processing and integration into a single coordinate systems of the 2013 and 2015 survey point clouds they were compared by the Cloud Compare software package. The algorithm used for that purpose measures orthogonal distances between the point clouds being compared. The resulting point cloud with values representing the orthogonal distances between the source point clouds can be used directly for quantificat ion of the relief dynamics. Example of such derivative point cloud visualization for one (eastern) of the surveyed coast sections containing 309036 survey points is shown on Fig. 3. Zones of dominant coastal cliff denudation and deposition along its base are clearly visible. Voids in the image represent partial data loss in one of the initial survey scenes. Possible reasons for that are either data filtering of vegetation reflections or partial lack of coverage due to some obstacles related to differences of the scanner orientation between the two surveys.
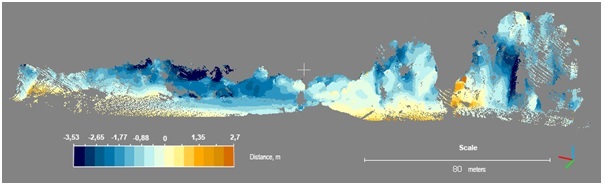
Fig. 3. Results of the two year survey point clouds (2013 and 2015) comparison for one of the monitoring sections.
Another possible way of quantitative analyses is based on histogram of distribution of the derivative point cloud values showing negative or positive distances between the two source point clouds from 2013 and 2015 surveys. Example of such histogram for the same survey section is shown on Fig. 4. Even from simple visual analysis it is evident that this particular section of the coastal cliff is dominated by denudation, with cliff retreat values exceeding 1 m over the 2013-2015 period for about 30% of the total number of the survey points.
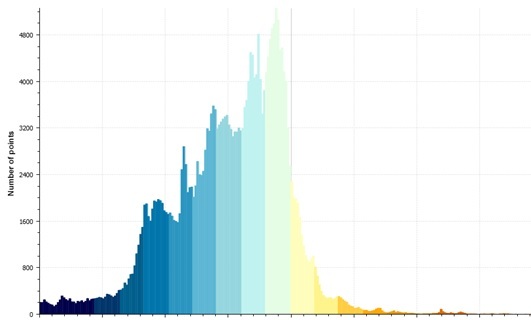
Fig. 4. Histogram of distances distribution between the two year survey point clouds (2013 and 2015).
Calculations of morphometric characteristics and volumetric assessment of coastal cliff dynamics were performed by the Autodesk Civil 3D software package with the Volumes Dashboard module. Thus module employs the calculation algorithm comparing triangulation surface models for each of the source survey point clouds and constructing a derivative composite surface used for volumetric differences estimation. Total area of scanning scenes being compared is 6987 m2. According to the survey results, total volume of the coastal cliff retreat over the 22 months passed between the consecutive surveys was estimated as 7512 m3, while volume of deposition along the cliff base and on the adjacent beach surface – 1173 m3. Mean value of cliff retreat from the derivative point cloud representing orthogonal distances between the source survey point clouds is -1.68 m.
V. Geomorphic interpretation of the TLS survey results
The 250 m long surveyed coastal section is located at the eastern outskirt of the Svetlogorsk City between the two pedestrian descents (staircases) to the sea from the “Rus” hotel and the “A.P. Gaidar” children rest house. Of its total length the easternmost 150 m are characterized by coastal cliff height about 7-10 m composed of dense glacial loams overlain by layers of loose alluvial and aeolian sands [5]. The western 100 m of the surveyed section is characterized by sharp increase of the cliff height up to 30 m. Higher part of the cliff is composed of interbedded dense glacial boulder loams and loose glaciofluvial sands and silts. Lithological composition of the higher cliff section favors active development of landslides, screes and earthfalls. Further to the west of the scanned section protective construction represented by gabion wall 4 m high was installed at the cliff base in 2008. This construction unsuitable for high cliff protection is already in damaged conditions. Its presence, nevertheless, results in declined volume of beach-forming sediment eroded from that part of cliff and available for longshore drift further eastward. This causes increased erosion of sand beaches along the gabion wall and downdrift, i.e. at the surveyed section. Average width of sandy beach along the gabion wall decreased from 30 to 5 m since 2008. Beach width along the scanned cliff section is 10-15 m under the high western part of the cliff and up to 30 m under the eastern part.
Analyzing the comparative orthogonal distances derivative point cloud visual representation (Fig. 3) and histogram (Fig. 4) the following methodic shortcomings must be noted. Firstly we have attempted to compare the scanning scenes surveyed from not exactly the same points with slightly different orientations of the scanner. This results in different detailness of surveys in the most problematic parts, potential presence of no-data zones obscured by cliff face irregularities, vegetation or other obstacles, seriously decreasing the quality of final results. Scanning of the cliff sections covered by bushes and trees, even devoid of leaves and not very dense, has not produced geomorphically meaningful results. Most of such zones on the visual representation of derivative point cloud are represented by voids (no-data zones in at least one of the source point clouds).
Nevertheless, the obtained results allow certain geomorphic interpretation. Firstly, it has been shown that average cliff retreat rate along the studied coastal section is about 0.9 m/year. Retreat of the lower part of the cliff is more spatially uniform with maximum values of 3 m per 22 months observed along its upper break with developed aeolian microtopography. At the same time, along the higher cliff section spatial variability of retreat rates is much higher with evident relatively stable zones separated by abruptly retreating areas of freshly collapsed landslide and earthfall scars with maximum retreat rate up to 4 m per 22 months. Colluvial deposits along the high cliff base are represented by zones of its temporary advance towards the sea up to 3 m. At the low cliff base, in contrast, there are only limited zones of ephemeral beach and aeolian sedimentation with amplitude up to 1 m. Average volume of material delivered on the beach surface by complex denudation of the cliff has also been estimated as about 15 m3 per 1 m of the coast length over the 22 months observation period.
The work was partly financed by the Russian Scientific Fund (grant 14-37-00047).
1. Burnashov E.M. Modern dynamics and environmental conditions of the Kaliningrad Region coastline. Ph.D. in Geography Thesis. Barnaul-2011.
2. Olsen, M.J., Johnstone, E., Kuester, F., Driscoll, N., Ashford, S.A. New automated point-cloud alignment for ground-based light detection and ranging data of long coastal sections // Journal of Surveying Engineering 137(1), 2011, pp. 14-25.
3. Rosser, N.J., Petley, D.N., Lim, M., Dunning, S.A., Allison, R.J. Terrestrial laser scanning for monitoring the process of hard rock coastal cliff erosion // Quarterly Journal of Engineering Geology and Hydrogeology 38 (4), 2005, pp. 363-375.
4. Brodu N., Lague D. 3D terrestrial lidar data classification of complex natural scenes using a multi-scale dimensionality criterion: Applications in geomorphology // ISPRS Journal of Photogrammetry and Remote Sensing. 68, 2012, pp. 121-134.
5. Zhindarev L.A., Habidov A.Sh., Trizno A.K. Dinamika peschanyh beregov morej i vnutrennih vodoemov (The dynamics of the sandy shores of the seas and inland reservoirs). Novosibirsk, Nauka Publ., 1998. 271p.